Fig. 2.
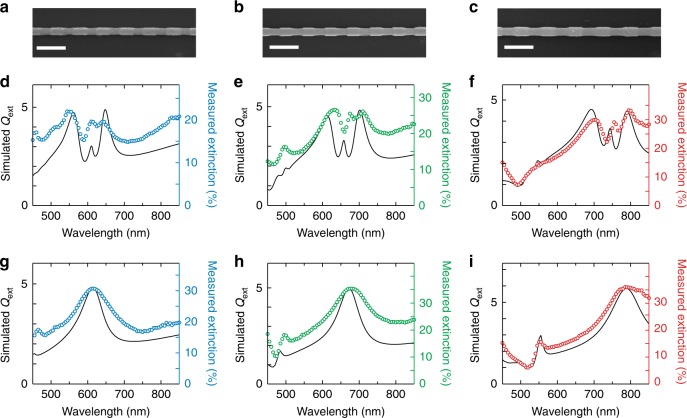
Experimental extinction spectra of NW GSLs. a–c SEM images of three NW GSL with geometrical parameters of d = 130 ± 1 nm, e = 114 ± 1 nm, p = 397 ± 10 nm (a), d = 145 ± 1 nm, e = 119 ± 5 nm, p = 383 ± 9 nm (b), and d = 158 ± 1 nm, e = 134 ± 2 nm, p = 465 ± 10 nm (c); scale bars, 500 nm. d–i Extinction spectra of NW GSLs (d–f) and of uniform NWs of the same diameters (g–i), showing experimentally measured extinction (colored circles and right-hand axes) and numerically simulated Qext (black lines and left-hand axes). Spectra in d–f correspond to the images in a–c, respectively

