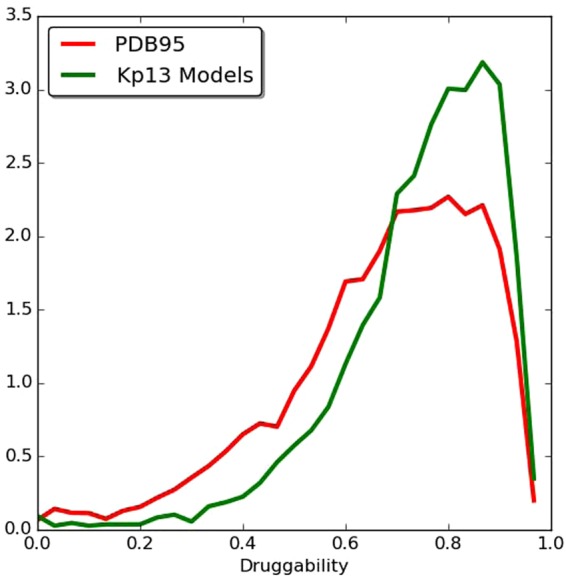
Figure 2.

Histogram of the druggability score. All ligand-bound structures in the PDB (red line) and all the modeled structures of Kp13 (green line) are represented in the histogram. The scores were computed using the fpocket program for all pockets present in all unique proteins in the PDB, which were crystallized in complex with a drug-like compound. A Gaussian fit of the data made to define these sets was performed in Radusky et al.33. The sets are: non-druggable proteins (ND; DS < 0.2), poorly druggable (PD; 0.2 ≤ DS < 0.5), druggable (D; 0.5 ≤ DS < 0.7), and highly druggable (HD; DS ≥ 0.7).
