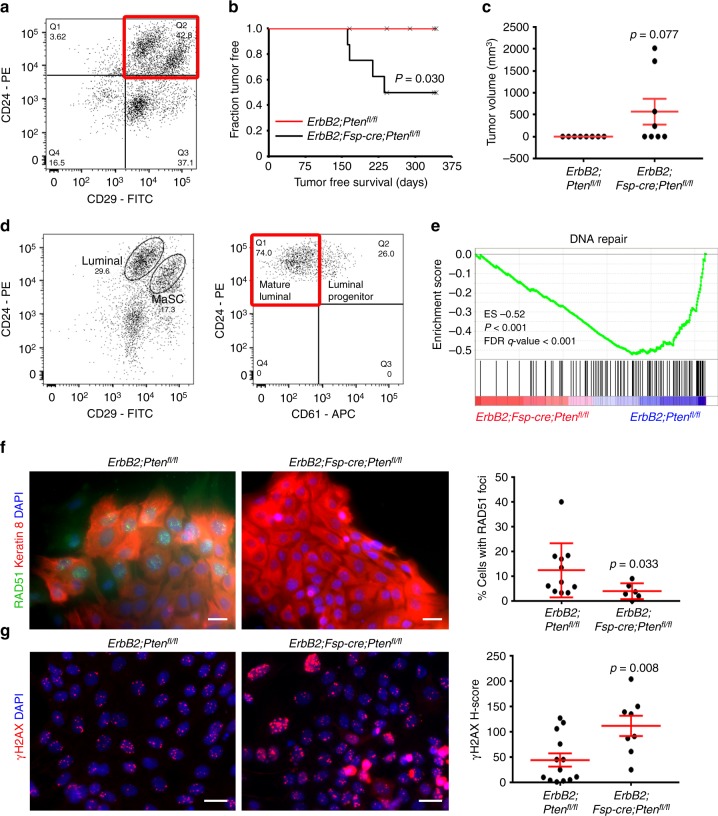
Fig. 1.
Loss of stromal PTEN decreases the DNA repair response in associated mammary epithelium. a Representative FACS plot defining CD24+CD29+ mammary epithelium (ErbB2;Fsp-cre;Ptenfl/fl). b Tumor-free survival of wild-type FVB/N mice injected orthotopically with ErbB2;Fsp-cre;Ptenfl/fl versus control ErbB2;Ptenfl/fl epithelium (n = 8/genotype). P value determined by Log-rank (Cox-Mantel). c Tumor volume (mean ± s.e.m.) at time of harvest after orthotopic injection of ErbB2;Fsp-cre;Ptenfl/fl (n = 8) versus control ErbB2;Ptenfl/fl (n = 7) epithelium. P value determined by Fisher’s exact. d Representative FACS plot defining ErbB2;Ptenfl/fl mammary epithelial subpopulations segregated by CD29 and CD24 (left: luminal and mammary stem cell (MaSC)) and CD61 (right: mature luminal and luminal progenitor). e Gene set enrichment analysis (GSEA) for DNA repair genes in ErbB2;Fsp-cre;Ptenfl/fl versus control ErbB2;Ptenfl/fl mature luminal epithelium. f Representative RAD51/keratin 8 dual immunofluorescence and quantification (mean ± s.e.m.) of epithelial cells isolated from ErbB2;Ptenfl/fl versus ErbB2;Fsp-cre;Ptenfl/fl mice irradiated (3 Gy) in vitro and evaluated 6 h post-radiation. P value determined by Welch’s t-test (ErbB2;Ptenfl/fl n = 11 fields/3 mice, ErbB2;Fsp-cre;Ptenfl/fl n = 6 fields/2 mice). Scale bar = 20 μm. g Representative γ-H2AX immunofluorescence and quantification (mean ± s.e.m.) of epithelial cells isolated from ErbB2;Ptenfl/fl and ErbB2;Fsp-cre;Ptenfl/fl mice irradiated (3 Gy) in vitro and evaluated 6 h post-radiation. P value determined by an unpaired, two-tailed Student’s t test (ErbB2;Ptenfl/fl n = 13 fields/3 mice, ErbB2;Fsp-cre;Ptenfl/fl n = 8 fields/3 mice). Scale bar = 20 μm

