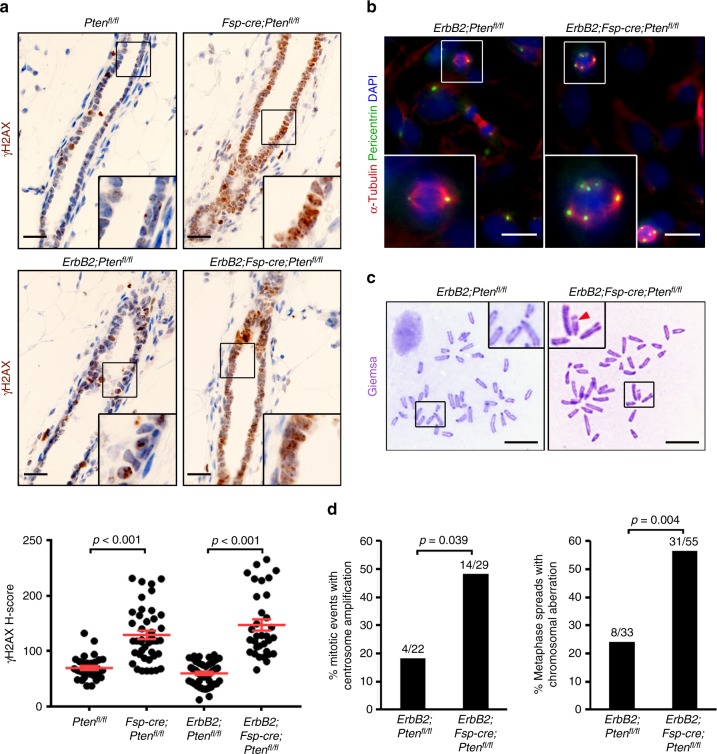
Fig. 2.
Loss of stromal PTEN increases genomic instability in associated epithelium. a Representative γ-H2AX immunohistochemistry and quantification (mean ± s.e.m.) of mammary epithelium in Ptenfl/fl, Fsp-cre;Ptenfl/fl, ErbB2;Ptenfl/fl and ErbB2;Fsp-cre;Ptenfl/fl mice irradiated (6 Gy whole-body) and evaluated 6 h post-radiation. Both p values determined by unpaired, two-tailed Student’s t test (Ptenfl/fl n = 32 fields/3 mice, Fsp-cre;Ptenfl/fl n = 42 fields/3 mice, ErbB2;Ptenfl/fl n = 47 fields/5 mice, ErbB2;Fsp-cre;Ptenfl/fl n = 33 fields/3 mice). Scale bar = 20 μm. b Representative α-Tubulin/pericentrin dual immunofluorescence of epithelial cells isolated from ErbB2;Ptenfl/fl and ErbB2;Fsp-cre;Ptenfl/fl mice irradiated (6 Gy whole-body) and evaluated 1 week post-radiation in vitro. Scale bar = 25 μm. c Representative metaphase spreads of epithelial cells isolated from ErbB2;Ptenfl/fl and ErbB2;Fsp-cre;Ptenfl/fl mice irradiated (6 Gy whole-body) and evaluated 1 week post-radiation in vitro. Arrowhead = chromosome break. Scale bar = 10 μm. d Quantification of centrosome amplification (shown in b) and chromosomal aberrations (shown in c) in epithelial cells isolated from ErbB2;Ptenfl/fl and ErbB2;Fsp-cre;Ptenfl/fl mice irradiated (6 Gy whole-body) and evaluated 1 week post-radiation in vitro. Both p values determined by two-tailed, Fisher’s exact test (left: ErbB2;Ptenfl/fl n = 22 fields/2 mice, ErbB2;Fsp-cre;Ptenfl/fl n = 29 fields/2 mice; right: ErbB2;Ptenfl/fl n = 33 spreads/4 mice, ErbB2;Fsp-cre;Ptenfl/fl n = 55 spreads/4 mice)

