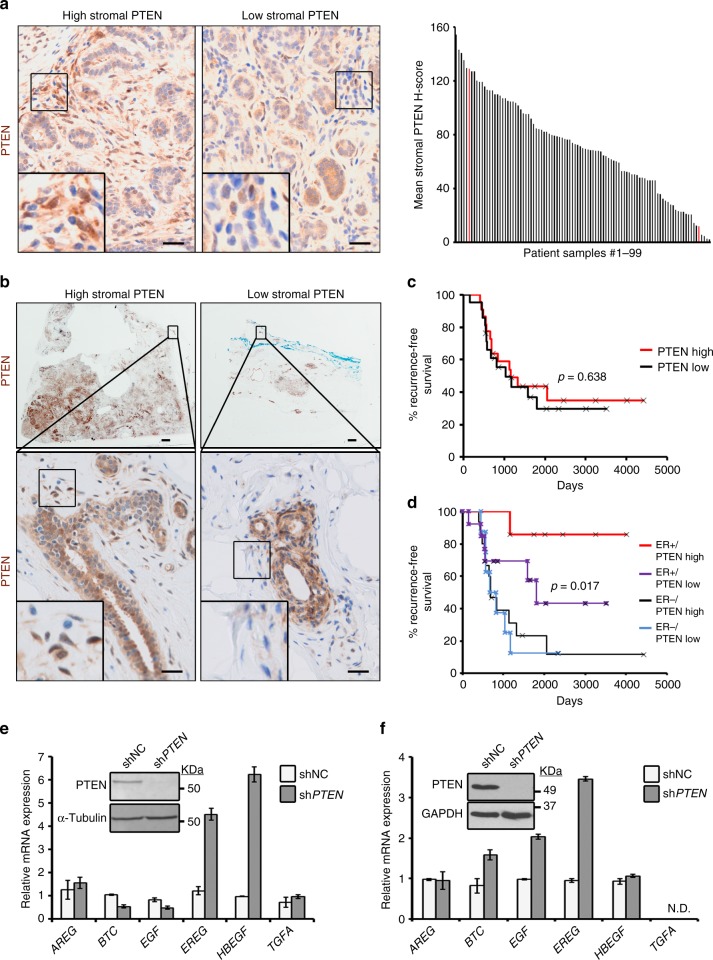
Fig. 5.
Low stromal PTEN is observed in normal breast tissue and predicts outcome in a HER2-positive breast cancer patient cohort. a Representative PTEN immunohistochemistry and quantification (mean of 4–10 representative fields/sample) in normal breast tissue isolated from women who underwent reduction mammoplasty (n = 99). Scale bars = 20 μm. b Representative PTEN immunohistochemistry in breast tumor samples isolated from women with HER2-positive disease treated with radiation therapy. Zoomed images show adjacent normal ductal tissue with either high or low stromal PTEN (high, n = 22 patients; low, PTEN n = 21 patients). Scale bars: top images = 1 mm; bottom images = 20 μm. c Kaplan–Meier analysis exhibiting recurrence probability within the HER2-positive patient population represented in (b) stratified by high versus low stromal PTEN (high, n = 22; low, n = 21). P value determined by Log-rank (Cox–Mantel). d Kaplan–Meier analysis exhibiting recurrence probability within the HER2-positive patient population represented in (b) stratified by high versus low stromal PTEN and ER status (ER-positive/PTEN-high, n = 7; ER-positive/PTEN-low, n = 13; ER-negative/PTEN-high, n = 15; ER-negative/PTEN-low, n = 8). P value determined by Log-rank (Cox-Mantel). e EGF ligand mRNA expression in primary cancer associated fibroblasts (CAFs) isolated from a breast cancer patient with and without PTEN lentiviral knockdown. Bars represent mean expression of technical replicates relative to Gapdh ± s.e.m. Inset shows western blot for PTEN and α-Tubulin. f EGF ligand mRNA expression in primary normal human breast fibroblasts (>10 cm from tumor) with and without PTEN lentiviral knockdown. Bars represent mean expression of technical replicates relative to Gapdh ± s.e.m. TGFA is not detectable (N.D.). Inset shows western blot for PTEN and GAPDH

