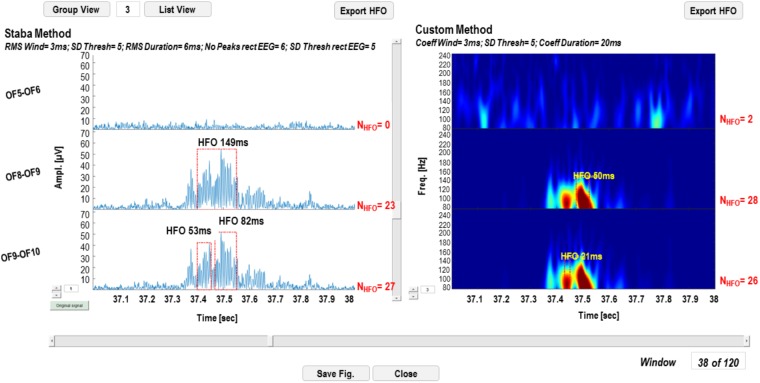
FIGURE 7.
High-frequency oscillation detection display GUI. In the left panel, the results of the detection with the Staba detector are reported, while on the right panel results of the wavelet-based detection are reported. The total number of detected HFOs is reported next to each channel. The detected HFOs are indicated in the two panels with red dotted rectangles, while the duration of the event with a text string.

