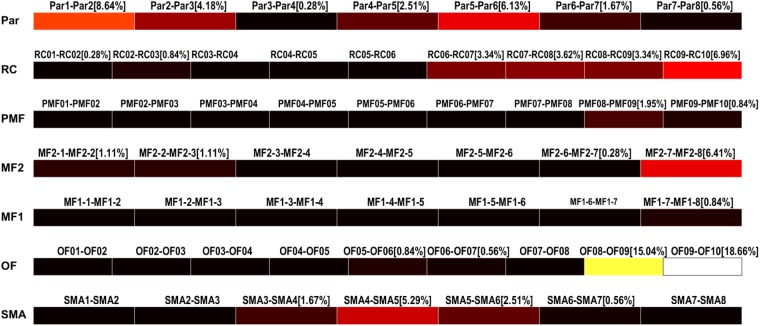
FIGURE 9.
High-frequency oscillation rates display. HFO rates relative to each channel (bipolar, strips, or grid contacts) are visualized as colored bars. Percentages represent the number of HFO detected on the specific channel over the total number of detected HFOs. Color ranges from black, meaning HFO rate of 0%, to white, representing the maximum HFO rate. In this case, OF09–OF10 and OF08–OF09 are the channels with the highest HFO rates, 18.66 and 15.04%, respectively.

