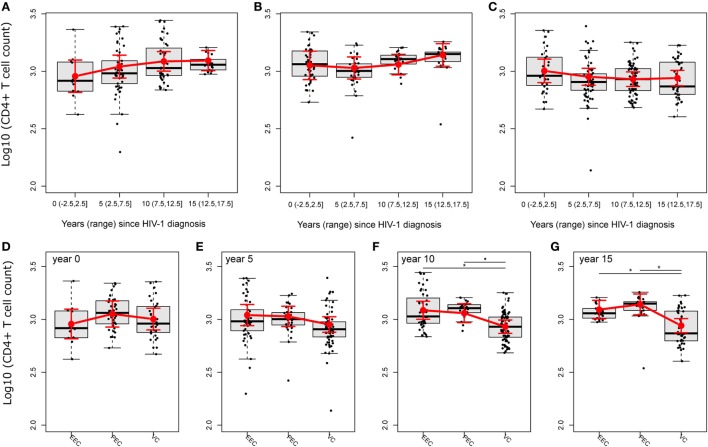
Figure 3.
HIV controllers (HICs) have no evidence of CD4+ T cell decline. Fitted (sample) instant in/decrement of log10-transformed CD4+ T cell counts at 5-year intervals (ranges) after HIV-1 diagnosis for HICs, ebbing elite controller (A), persistent elite controller (B), and viremic controller (C), and the comparison of fitted mean log10-transformed CD4+ T cell counts among HICs at year 0 (D), 5 (E), 10 (F), and 15 (G) after HIV-1 diagnosis. Analysis was performed by selecting the best nested linear mixed-effect models fitted by maximum likelihood. Deviance analysis was performed among nested models by F-test with Kenward–Roger approximation. Slopes/contrasts were obtained from the best fitted models to compare CD4+ T cell counts kinetic estimated means and CI 95% (red dots and vertical bars) among HIC groups of individuals. Degrees of freedom for estimated effects were approximated by the Satterthwaite method. Boxplots represent the IQR and sample median (central solid black line). Red dots and vertical bars represent linear model estimated adjusted means and 95% confidence intervals (CI 95%). Again, P-values were corrected by the Tukey Honest Significant Difference. ▪P < 0.1, *P < 0.05.

