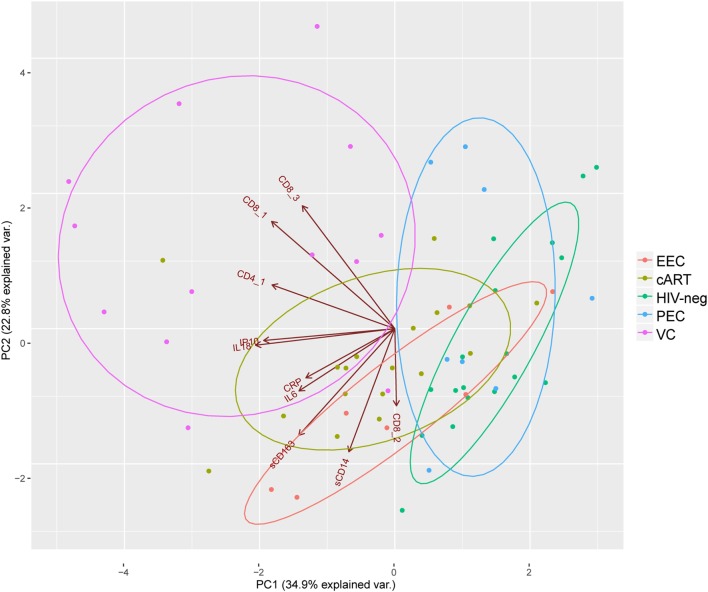
Figure 5.
Principal component analysis highlights elite controllers with an immune profile similar to HIV-1 negative individuals: CD8_1, CD8+CD38+HLA-DR+; CD8_2, CD8+HLA-DR+; CD8_3, CD8+CD38+; CD4_1, CD4+CD38+HLA-DR+. Brown directed vectors represent the contribution of each variable for the formation of the two-principal components. Colored ellipses represent the 68% of the normal concentration for each group.

