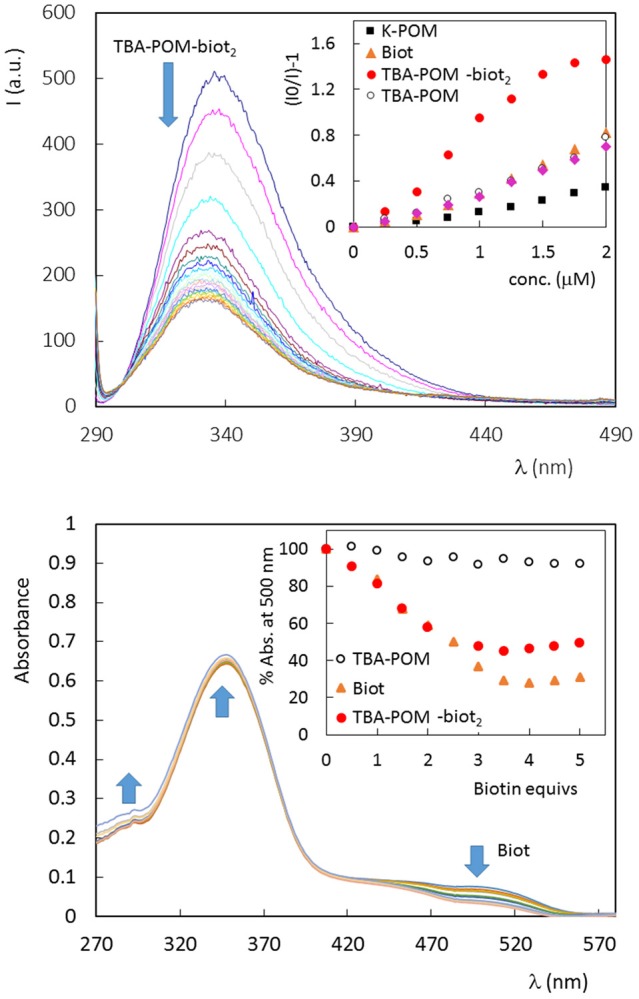
Figure 2.

(Top) Fluorescence spectrum of avidin (1 × 10⁻⁶ M, in PBS 5% DMSO, 25°C) in the presence of increasing amount of TBA-POM-biot2 (0–6 μm) dissolved in PBS 5% DMSO. Excitation wavelength: 280 nm; 1 cm path length quartz cell. Inset: Stern-Volmer graphs, obtained for the fluorescence emission at 338 nm, in the presence of different POMs or Biot, in the range 0–2 μM. (Bottom) UV-vis spectra of tetrameric avidin-HABA (0.65 × 10⁻⁶ M, in HEPES buffer, 25°C) in the presence of increasing amount of biotin equivalents. Inset: % absorbance decrease observed at 500 nm in the presence of Biot (0–0.81 μM) or different POMs (0–0.41 μM, 1 biotin equiv. corresponding to 0.5 POM equivs.).
