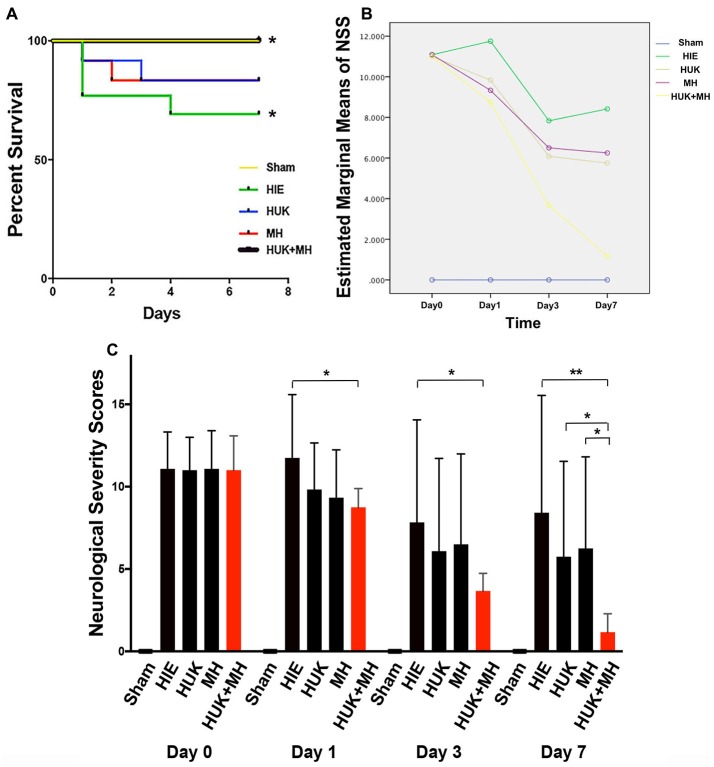
Figure 2.
Survival curves and the analysis of NSS. (A) 7-day survival curves: the 7-day survival curves were created according to the deaths in each group at different time points (n = 12). The survival curve of HIE group was the lowest in the survival curve chart, 4 out of 12 died, three were at day 1 and one at day 4. HUK or MH ended with two deaths of 12. The best survival curve (0 out of 12 died) was noted when HUK was combined with MH, which was the same as the Sham Group (0 out of 12 died). The survival curves of HUK and MH groups have no difference with that of the HIE group (Log-Rank Test (Kaplan-Meier), χ2 = 0.848, P = 0.357), but the survival curve of combination is better than that of the HIE group (Log-Rank Test (Kaplan-Meier), χ2 = 4.615, *P = 0.032). (B) The analysis of NSS scores: Mauchly’s test of sphericity shows the NSS scores does not fit the spherical distribution (Mauchly’s test of sphericity, χ2 = 85.722, ***P < 0.001). There is an interaction between the different treatments and the time points (MANOVA, F = 6.990, ***P < 0.001). (C) NSS analyses in groups: among the Sham, HIE, HUK, MH and combination of HUK and MH groups (n = 12), NSS assessments were carried out at day 0, day 1, day 3 and day 7. The bar shows the NSS score of every group. The NSS scores are statistically different at different time points (MANOVA, F = 61.585, ***P < 0.001). At day 0, there is no statistical difference among different treatments (MANOVA, Fday 0 = 0.006, Pday 0 = 0.999). At day 1 and day 3, only combination, not HUK or MH alone reduced the NSS scores after HIE (MANOVA, LSD test, *Pday 1: Combi-HIE = 0.013, *Pday 3: Combi-HIE = 0.049). At day 7, the combination reduces the NSS scores compared to HIE (MANOVA, LSD test, **PCombi-HIE = 0.002), and better than HUK or MH (MANOVA, LSD test, *PCombi-HUK = 0.043, *PCombi-MH = 0.026). But neither HUK nor MH were different to the HIE group (MANOVA, LSD test, PHUK-HIE = 0.233, PMH-HIE = 0.331). *P < 0.05, **P < 0.01, ***P < 0.001.

