
FIGURE 5.
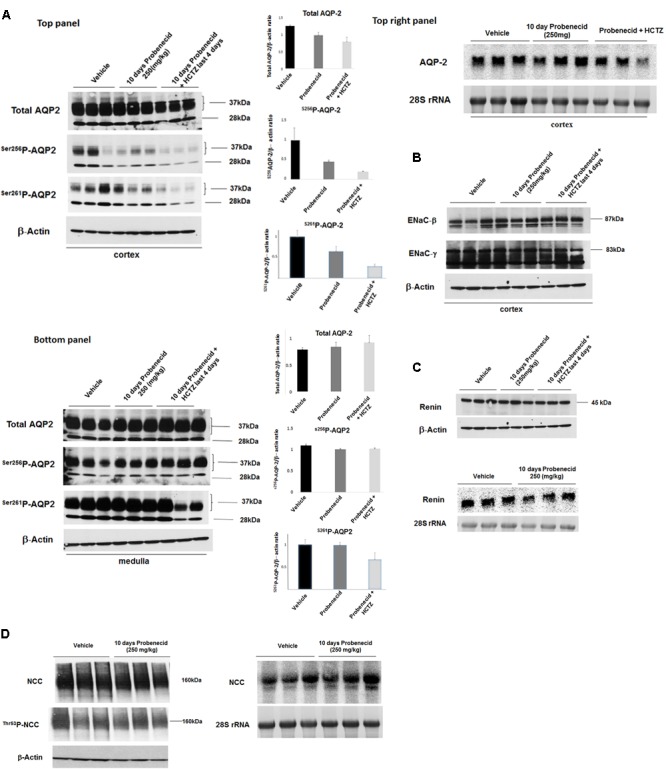
Expression levels of AQP-2, ENaC subunits and renin in kidneys of experimental groups. (A) AQP2 expression by western and northern hybridization. The expression levels of AQP2 in the cortex and medulla of Vehicle, probenecid, and probenecid/HCTZ treated animals was assessed by western blot analysis. There were no significant differences in Total AQP2, Ser256p-AQP2 or Ser261p-AQP2 levels in the medulla of Vehicle versus probenecid (p = 0.41; p = 0.40; or p = 0.94 respectively) or probenecid/HCTZ (p = 0.12; p = 0.98; or p = 15 respectively) animals when the densitometry values were normalized against β-Actin. There were no significant differences between Total AQP2, Ser256p-AQP2 or Ser261p-AQP2 in the cortices of Vehicle versus probenecid (p = 0.07, p = 0.20, and 0.15; respectively). However, there was a significant difference between the cortices of Vehicle versus probenecid + HCTZ in Total AQP2 (p = 0.0001, n = 3) and Ser261p-AQP2 (p = 0.01, n = 3) (A, left top and bottom panels). Northern blot analyses (B, right top panel) were performed on RNA samples from the cortices of probenecid treated (250 mg/kg) animals. As indicated, mRNA expression levels were not significantly different in vehicle and probenecid treated rats (p = 0.33). (B) ENaC Western blot. The expression levels of ENaC subunits, alpha and gamma, in the cortex were examined using subunit-specific antibodies. As indicated, both subunits showed comparable expression levels in experimental groups. (C) Renin Western and Northern blots. Protein and RNA values were quantified and normalized based on β-Actin or 28S rRNA, respectively. Protein abundance (top panel) and RNA expression (bottom panel) of renin in kidney cortex of Vehicle, probenecid-treated (250 mg/kg/day) and probenecid/HCTZ-treated groups were comparable (p = 0.293, n = 3/group for Western; p = 0.34, n = 3/group for Northern) (C). Student’s unpaired t-test was used for statistical analysis. (D) NCC Western and Northern Blots. The NCC mRNA expression levels (D, right) were comparable in both Vehicle (0.94 ± 0.09, n = 3) and in 250 mg/kg probenecid treatment animals (0.96 ± 0.1, n = 3; p = 0.90). Western blot analysis of total NCC and phosphorylated NCC were comparable in Control and 250 mg/kg/day probenecid treated groups. Left upper panel (NCC): Vehicle (1.02 ± 0.09, n = 3) vs. probenecid (1.02 ± 0.02, n = 3); p = 0.98; and left middle panel (Thr53p-NCC): Vehicle (0.87 ± 0.13, n = 3) vs. probenecid (0.87 ± 0.03, n = 3); p = 0.97.