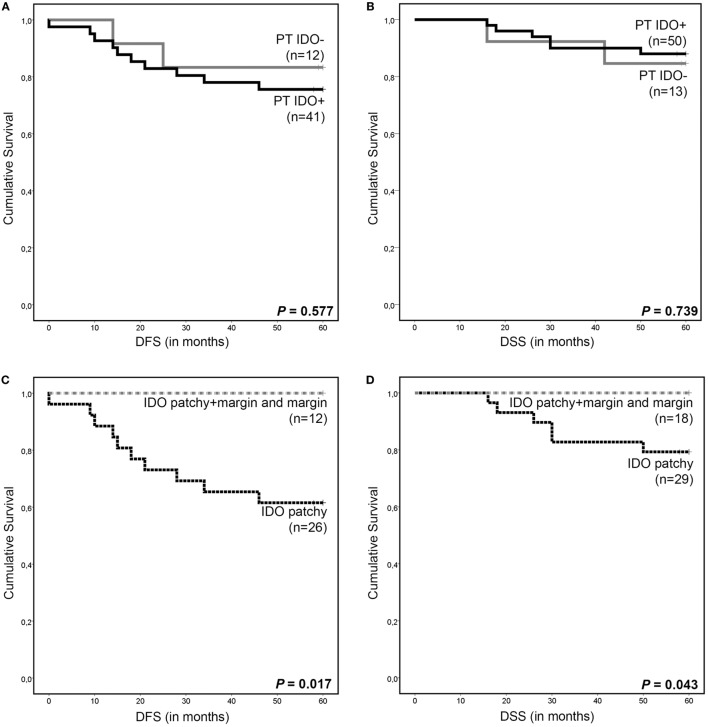
Figure 4.
Survival analysis according to indoleamine 2,3-dioxygenase (IDO) expression in cervical cancer. Kaplan–Meier 5-year survival curve shows (A) disease-free survival (DFS) and (B) disease-specific survival (DSS) for patients with IDO-positive primary tumors (PT IDO+, black line) and IDO-negative (PTs IDO−, gray line). Kaplan–Meier 5-year survival curves show (C) DFS and (D) DSS for patients with patchy IDO expression (black dotted line), for patients with marginal, including patchy + marginal, IDO expression (gray dotted line) by PT cells. P values were calculated between the different groups using the log-rank test. NB: for some patients, DFS and DSS data are missing due to loss of follow-up.

