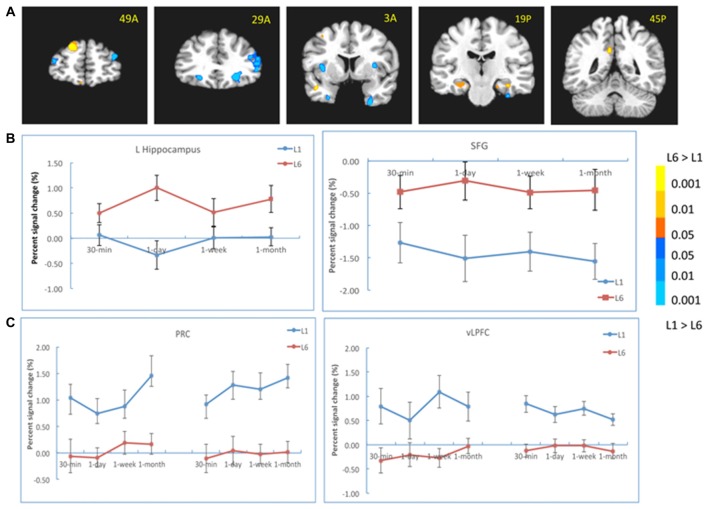
Figure 4.
Results of the learning effect. (A) The left hippocampus, the posterior cingulate cortex (PCC) and the superior frontal cortex (SFG) showed stronger activation for the L6 than for the L1 group, whereas the bilateral perirhinal cortex (PRC), the right inferior prefrontal cortex (IFG), bilateral ventrolateral prefrontal cortex (vLPFC) and bilateral insula/thalamus showed stronger activation for the L1 than for the L6 group. (B) The activation of the hippocampus and SFG at each retention interval. (C) The activation of the PRC and vLPFC at each retention interval. The color bar represents the contrast between L1 and L6. The left is on the left side for each brain slice.

