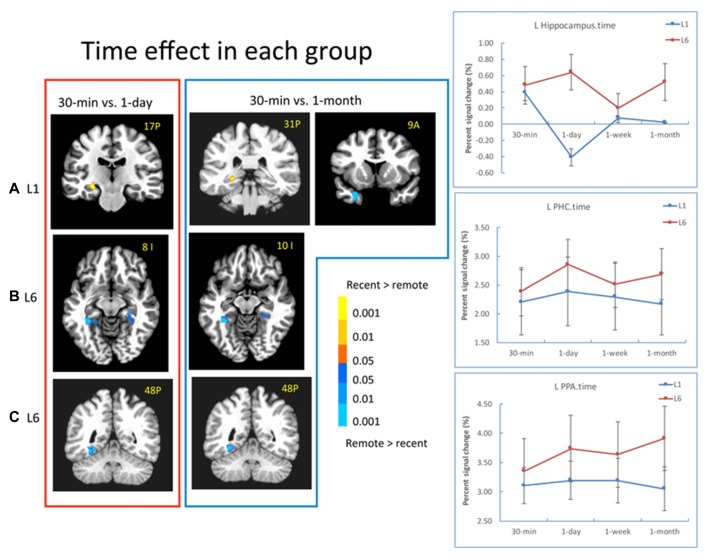
Figure 5.
Results of the time effect. (A) For the L1 group, the hippocampal activation decreased from 30-min to 1-day, and 30-min to 1-month. The EC/PRC showed increased activation from 30-min to 1-month. (B,C) For the L6 group, the activation of the parahippocampal cortex (PHC) and parahippocampal place area (PPA) significantly increased when 30-min was compared with 1-day and 1-month intervals. The brain activation in the red frame represents the contrast of 30-min vs. 1-day, and that in the blue frame represents the contrast of 30-min vs. 1-month. The left is on the left side for each brain slice. The color bar represents the contrast between recent vs. remote intervals (e.g., 30-min vs. 1-day). The signal changes of the left hippocampus, PHC and PPA in the contrast of 30-min vs. 1-day (i.e., red frame) are plotted for each condition.

