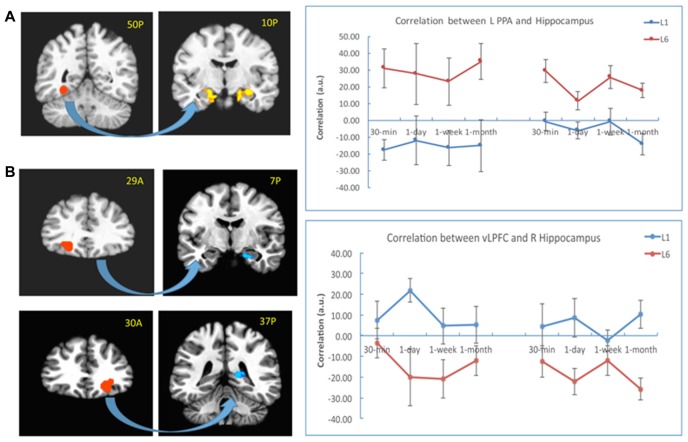
Figure 6.
PPI results with the PPA and vLPFC as seeds. (A) The connectivity between the left PPA (as seed in the left) and the bilateral hippocampus (in the right) increased for the L6 (vs. L1) group. (B) The connectivity between the bilateral vLPFC (as seeds in the left) and the hippocampus (in the right) decreased for the L6 (vs. L1) group. The warm color represents increased connectivity for L6 vs. L1, and the cold color represents increased connectivity for L1 vs. L6. The left is on the left side for each brain slice.

