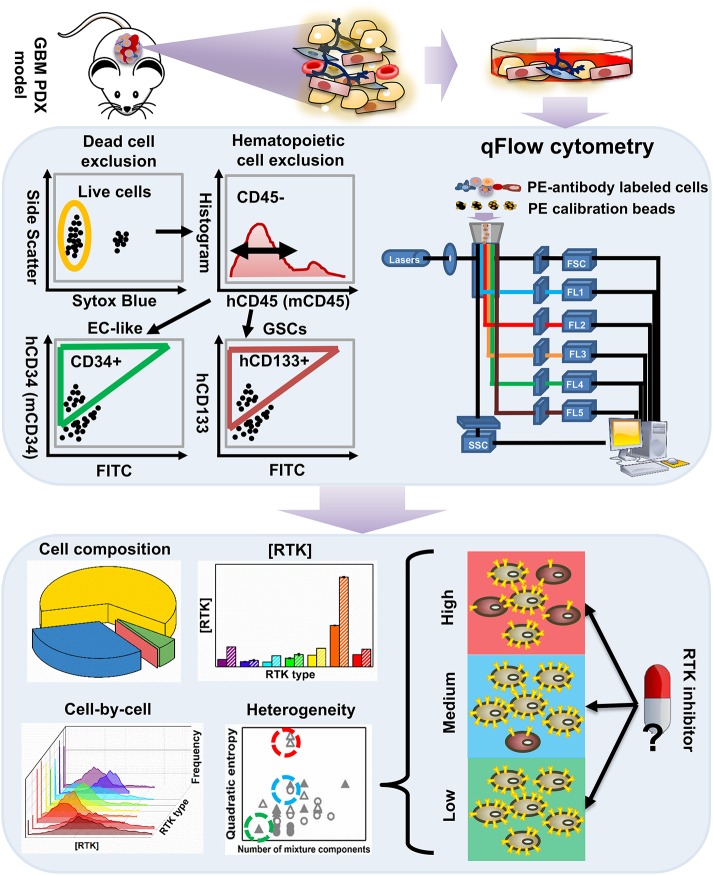
Figure 1.
An overview of the workflow for characterizing tumor heterogeneity in GBM39 PDX samples. The GBM39 PDX is established with tumor tissue from patients at Mayo Clinic, Rochester, MN. Following dissociation, multi-channel flow cytometer is used to characterize PDX cells. Briefly, dead cells are excluded using a live/dead cell stain, and hematopoietic cells are excluded using the CD45 antigen, then the endothelial marker CD34 and CD133 can be used to identify EC-like cells and GSCs respectively from the CD45− pool. Percentage of GSCs, EC-like cells and other PDX cells within all live cells can be exported from the flow cytometer. Cells are also stained with phycoerythrin (PE)-conjugated antibodies targeting one of the 9 plasma membrane RTKs: established GBM biomarkers, EGFR and IGFR, and those within the angiogenic signaling networks, VEGFRs, PDGFRs, NRP1, and Tie2. qFlow cytometry is performed as described previously, and ensemble averaged plasma membrane RTK concentrations and cell-by-cell RTK distributions can be obtained (Imoukhuede and Popel, 2011; Chen et al., 2015, 2017). We use two parameters to quantify RTK heterogeneity across EC-like and non EC-like cells: number of mixture components and Quadratic entropy of the cell-by-cell RTK distribution. Bayesian Information Criterion (BIC)-guided Gaussian mixture modeling is used to select the best number of mixture components existed in a larger cell population based on their RTK concentration. Alternatively, Quadratic entropy sums the weighted differences of the means between two bins from 500 equally distributed bins from each cell-by-cell distribution. We envision that characterizing RTK heterogeneity may help understand why RTK inhibitors have not been efficient in treating GBMs.

