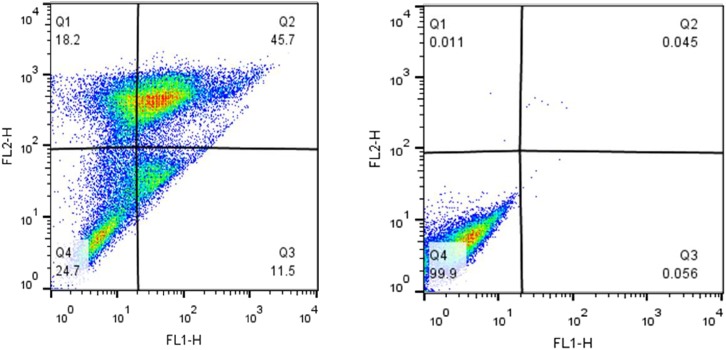
FIGURE 5.
The impact of tamoxifen on apoptosis of MCF-7 cancer cells. Quadrants were drawn based on FSC/SSC plot in the untreated cells. Percent apoptosis was determined using two dimensional plot of PI (PI, Y-axis) and Annexin V-FITC (X-axis). (Left) Treated cells with a single dose of tamoxifen (250 μM), and (Right) the untreated control. Different cellular distributions are shown in the quadrants, Q1, necrotic cells; Q2, late apoptotic cells; Q3, early apoptotic cells; and Q4, normal cells.

