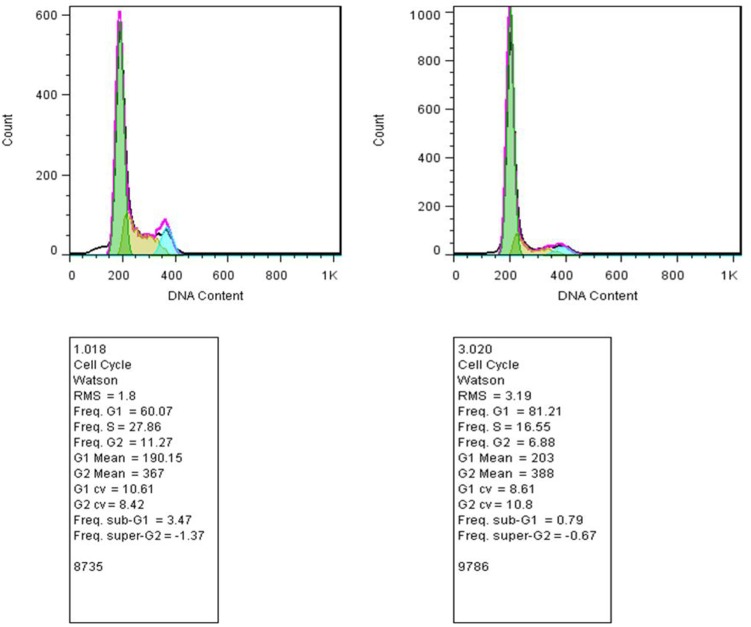
FIGURE 6.
Study of the cell distribution in different cell cycle stages. (Left) MCF-7 cells incubated with tamoxifen, and (Right) control cells. The bell-shaped curves from left to right correspond to the G1, S, G2/M phases of the cell cycle in the control and cells incubated with tamoxifen. Incubation of cells with tamoxifen did not significantly shift the distribution of the cells in different phases of the cell cycle compared with control. As in the treated group, there were minor increases, about 10 and 6%, in the S and G2 phases of the cell cycle, respectively.

