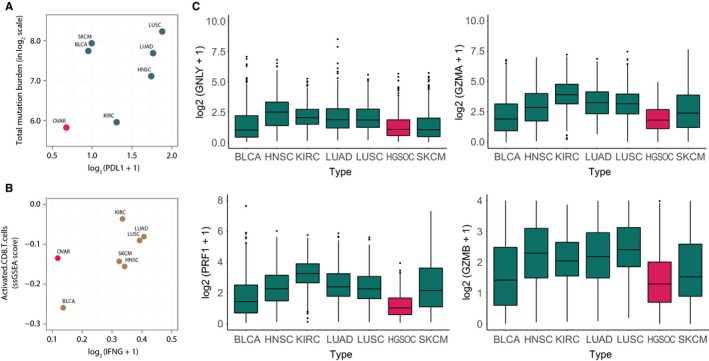
Figure 1.

Total mutation load and PD‐L1 expression in several solid tumour types.A, Relative relationships between PD‐L1 expression levels and total mutation burden (TMB) across multiple solid tumour types (BLCA, OVAR, LUAD, NHSC, LUSC, KIRC, SKCM); B, Relative relationships between activated CD8+ T cells and interferon‐γ (IFN‐γ) in solid tumours; C, Cytotoxicity represented by GNLY, PRF1, GZMA and GZMB in different tumours
