
Figure 3.
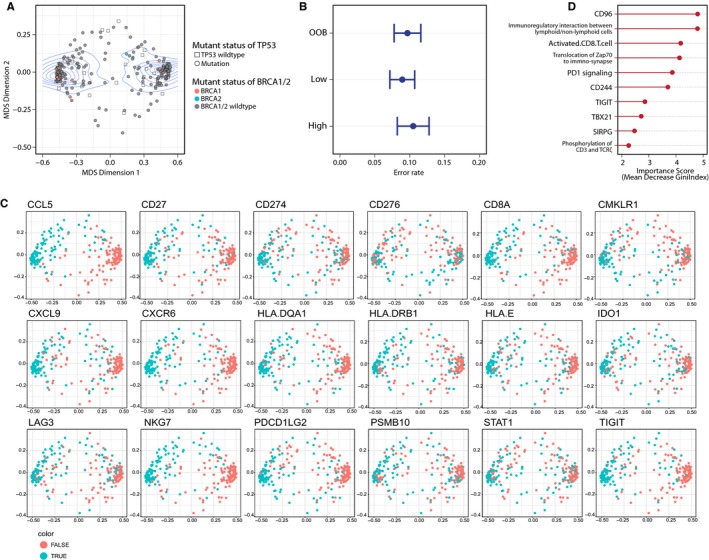
Machine learning identified dominant factors in determining cytolytic activity. A, Density contour Gaussian maximum fitting revealed 2 categories according to levels of cytolytic activity; B, Error rate of group OOB, low and high; C, The ten most important signatures that matters in the categorization; D, Immune features in the 2 categories applied from KEYNOTE‐059 trial. Dots were coloured based on the expression level of each gene