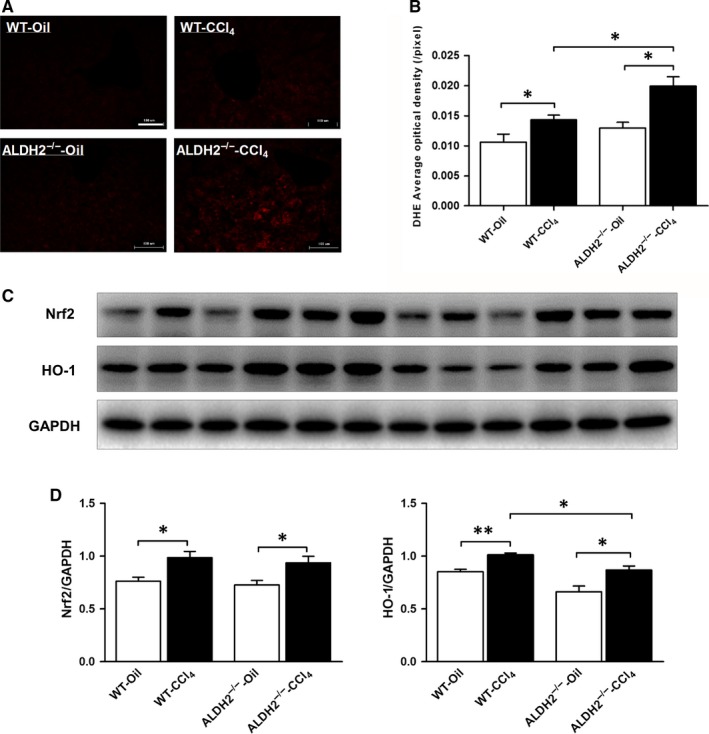
Figure 3.

ALDH2−/− mice showed more ROS generation in response to CCl4 administration. A, Representative images of DHE staining. B, Quantification of DHE density. The values represent means ± SEM. (n = 7‐9) *P < .05. Scare bar, 100 μm. C, Representative western blot pictures of Nrf2 and HO‐1. D, Western blot analyses of Nrf2 and HO‐1
