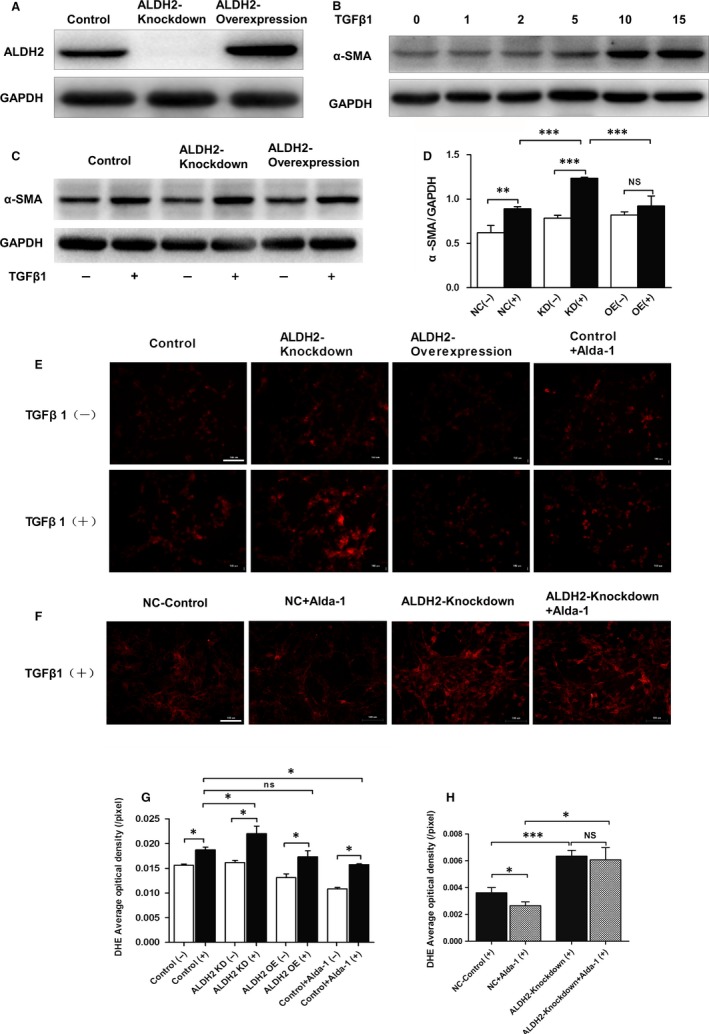
Figure 6.

ALDH2 activation reduced TGF‐β1‐induced HSC‐T6 cell activation along with attenuation of ROS generation. A, Representative western blot pictures of rat hepatic stellate cells transfected with scramble, ALDH2 knockdown and ALDH2 overexpression lentiviral vectors. B, Western blot analyses of α‐SMA indicated HSC‐T6 activation induced by a variety concentration of TGF‐β1. C, Representative western blot pictures of α‐SMA with or without TGF‐β1 administration. D, Quantification analyses of the expression of α‐SMA. E, Representative DHE staining with or without TGF‐β1 administration. F, Representative DHE staining with or without Alda‐1 administration. G, H, Quantification of DHE staining. The values represent means ± SEM. *P < .05, **P < .01, ***P < .001. Scare bar, 100 μm
