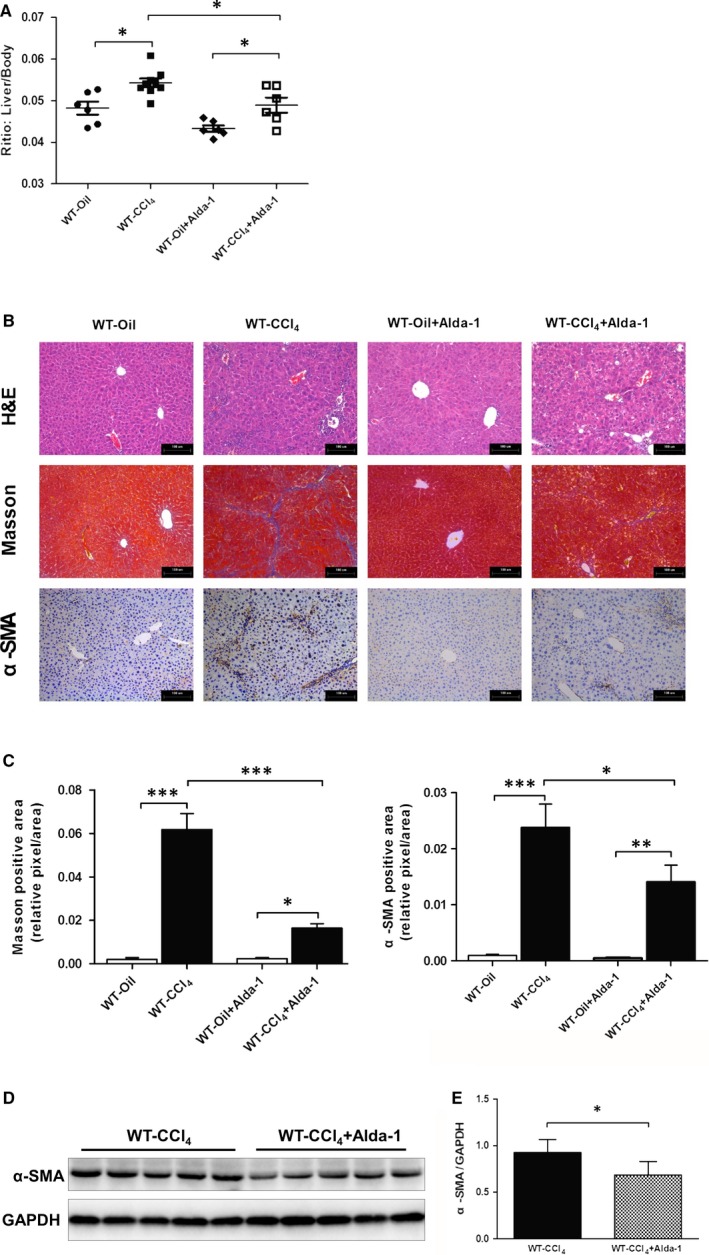
Figure 7.

Alda‐1 alleviated chronic CCl4‐induced liver fibrosis. A, Liver/bodyweight ratio. B, Representative histopathological pictures of the liver. Upper panel: Representative H&E staining. Middle panel: Representative Masson's trichrome staining. Lower panel: Representative images of α‐SMA staining. C, Quantification of Masson's trichrome and α‐SMA‐positive area. D, Representative western blot pictures of α‐SMA. E, Quantification analyses of the expression of α‐SMA. The values represent means ± SEM (n = 6‐9). *P < .05, **P < .01, ***P < .001. Scare bar, 100 μm
