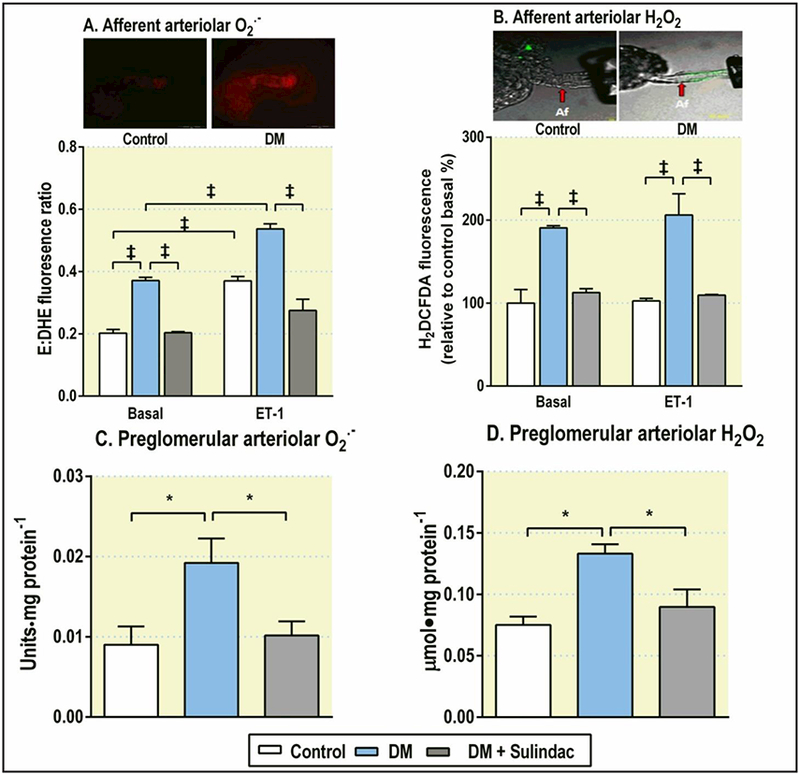
Fig. 2.

Mean ± SEM values (n=5) for O2.− and H2O2 in the perfused individual afferent arteriole (A and B) or in the isolated preglomerular arterioles (C and D) from control mice (open boxes), diabetic mice (blue filled boxes) and sulindac treated diabetic mice (grey filled boxes). Data are shown as the basal levels of ethidium:dihydroethidium (E:DHE) fluorescence ratio for O2.−, H2DCFDA fluorescence for H2O2, their changes in response to ET-1 (10−8 mol·l−1) in the perfused individual arteriole and units (or μmol)·mg-l protein for their concentrations in the isolated preglomerular arterioles. Comparing groups: * P<0.05; ‡ P< 0.001.
