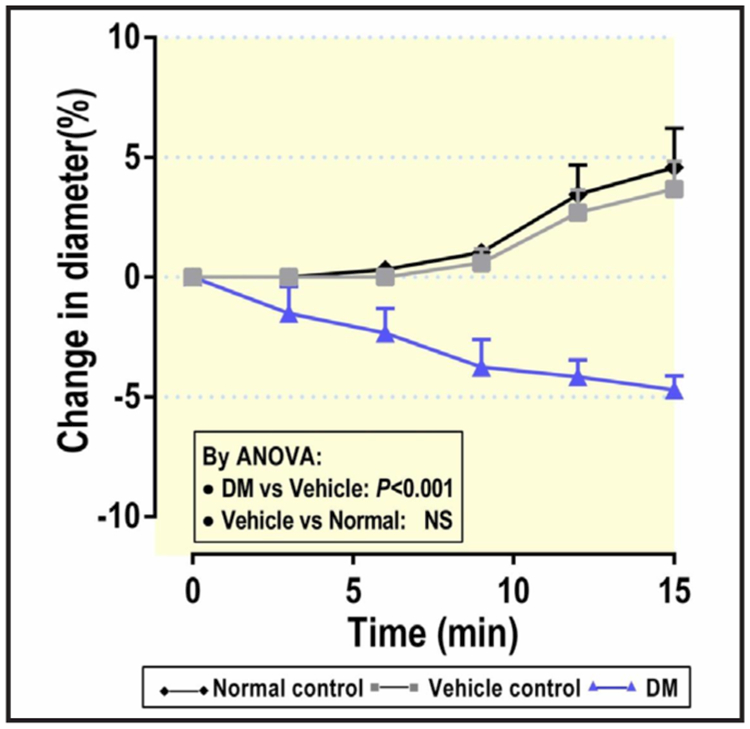
Fig. 3.

Time course of changes in luminal diameter of perfused afferent arterioles (n=5) from normal control (without injection, black diamonds with solid line), vehicle control (7 days after injection of citrate buffer, grey diamonds with grey line) and diabetic mice (7 days after injection of STZ, blue triangles with blue line) by bath addition of H2O2 (10 μmol·l−1). ANOVA, analysis of variance.
