. 2018 Jun 6;9(26):5842–5849. doi: 10.1039/c8sc01981a

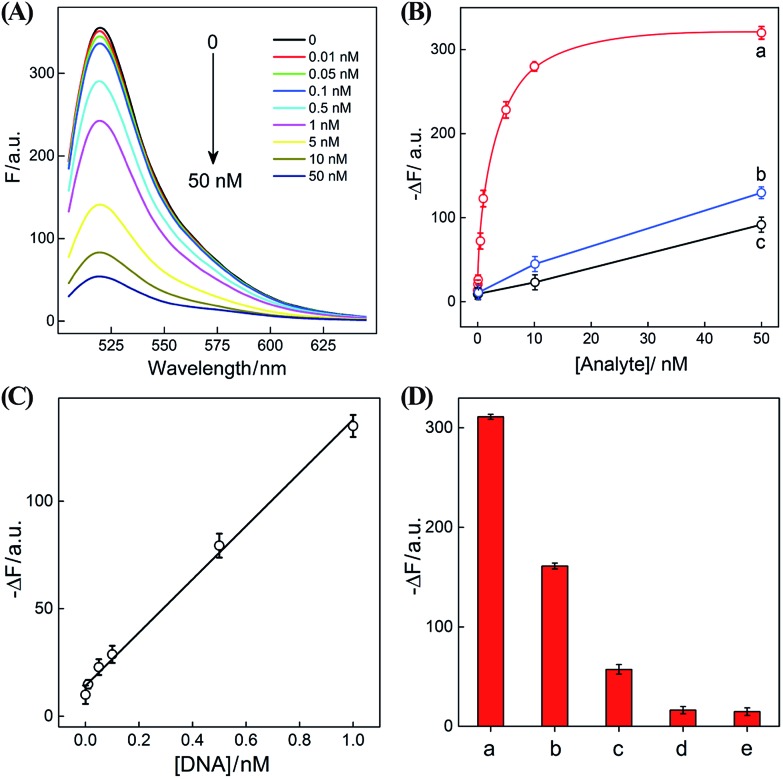
Fig. 4. (A) Fluorescence spectra of the sensing system with different concentrations of initiator I. (B) Calibration curves of (a) CHA–HCR, (b) HCR, and (c) CHA systems with different concentrations of their corresponding analytes. (C) Resulting linear correlationship curve of the CHA–HCR system. (D) Fluorescence intensity (at λ = 520 nm) of the CHA–HCR-based sensing system with different analytes for a fixed time interval of 5 h: (a) I, 50 nM, (b) Ia, 50 nM, (c) Ib, 50 nM, (d) Ic, 50 nM, and (e) no analyte. Here –ΔF represents the absolute fluorescence change of FAM. The system consisting of 400 nM H1, 400 nM H2, 400 nM H3, 200 nM H4, 200 nM H5 and 200 nM H6 was carried out in reaction buffer for 5 h. Error bars were derived from n = 5 experiments.

Fig. 4