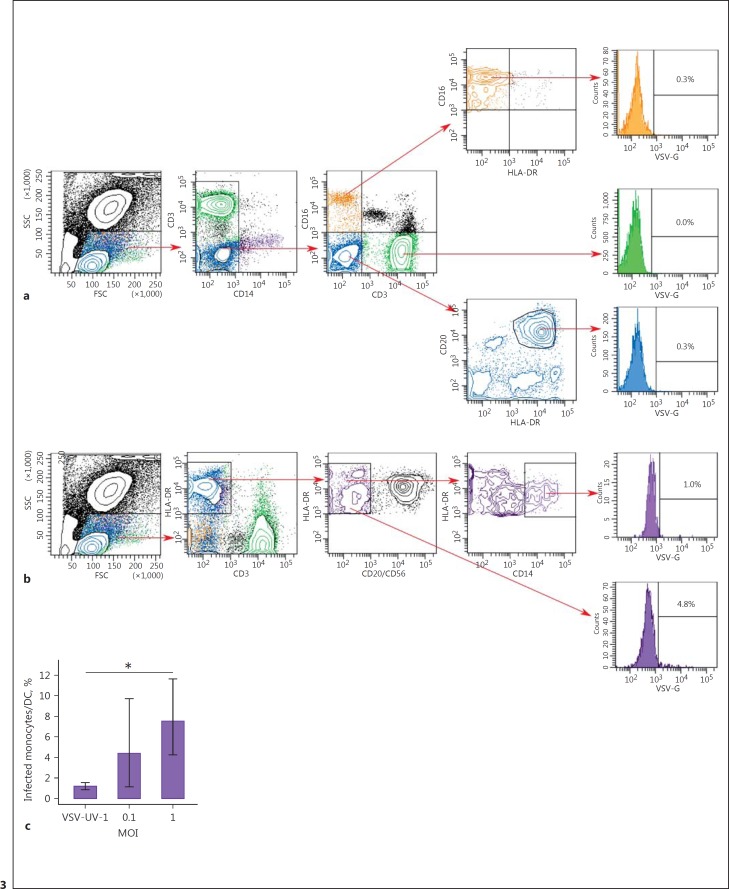
Fig. 3.
Simultaneous detection of VSV-G in immune cell subsets. Flow cytometric analysis of T cells, B cells, and NK cells (a) as well as monocytes and monocytes/DC (b) 18 h after VSV infection at MOI = 1. A total of 50,000 cells were acquired. Data shown are from 1 representative donor. The percentage of VSV-G-positive (VSV-G+) cells are indicated. c Percentage of VSV-infected cells within HLA-DR+ population. The error bars represent the means of 4 donors ± 95% confidence interval (t test, * p < 0.05).

