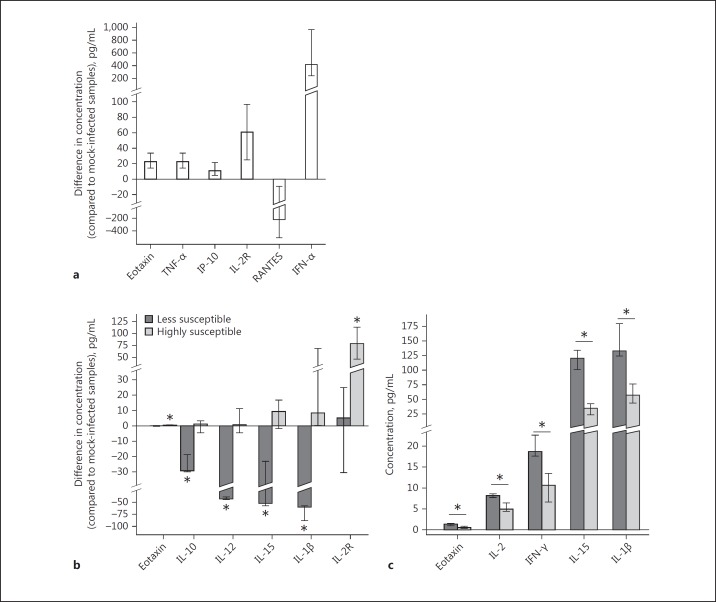
Fig. 8.
The production of cytokines by PBLs ex vivo in response to VSV infection from donors highly susceptible or less susceptible to VSV. a Differences in the concentration of cytokines (compared to mock-infected controls) after VSV infection (n = 13; Wilcoxon signed-rank test or Student's t test, p < 0.05). The bar represents mean/median (depending on whether a nonparametric or parametric test was used during the analysis) with the whiskers as interquartile range or 95% confidence interval for the mean. All presented results are statistically significant. b Differences in the concentration of cytokines after VSV infection between donors less susceptible (dark-grey bars, n = 3) or highly susceptible (light-grey bars, n = 10) to the virus. Results are presented as median with interquartile range (exact permutation test, * p < 0.05). c Spontaneous cytokine production in uninfected samples from donors less susceptible (dark-grey bars, n = 3) or highly susceptible (light-grey bars, n = 10) to VSV infection. Results are presented as median with interquartile range (exact permutation test, * p < 0.05).

