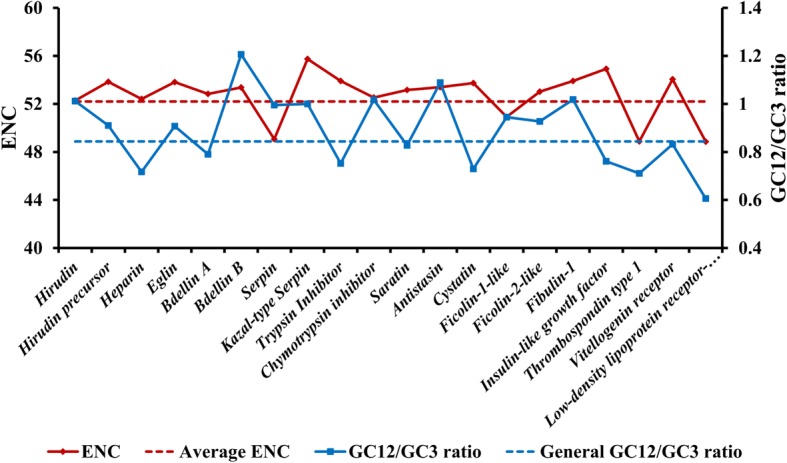
Fig. 5.

Comparisons of GC12/GC3 ratio and ENC values between different functional categories. The average ENC and general GC12/GC3 values were used to illustrate the differences of these CDSs from the overall tendency, the average ENC value is obtained as 52.2 and general GC12/GC3 ratio is calculated to be 0.83
