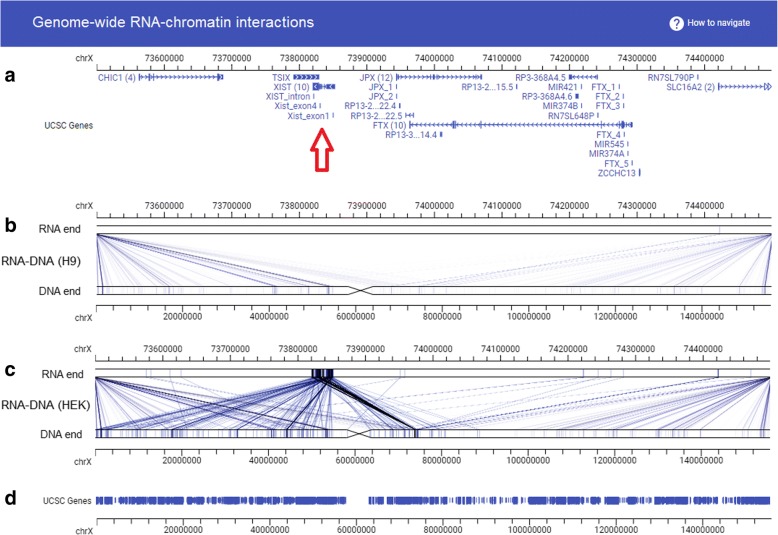
Fig. 2.
A custom website hosting genome-wide RNA-DNA interaction datasets. Panels from top to bottom are (a) genome coordinates (chrX:73500000–74,500,000) and genes, (b) RNA-DNA interaction data in human embryonic (H9) stem cells with the RNA end (top) and the DNA end (bottom) shown with different resolutions (coordinate bars), (c) RNA–DNA interaction data in human embryonic kidney (HEK) cells with the RNA end (top) and the DNA end (bottom) shown with different resolutions (coordinate bars), and (d) genes and genome coordinates. Red arrow points to the genomic location of the Xist gene, where no RNA was produced in H9 (b) but plenty of RNA was produced and interact with X chromosome in HEK (c). Data were produced by the MARGI technology [8]

