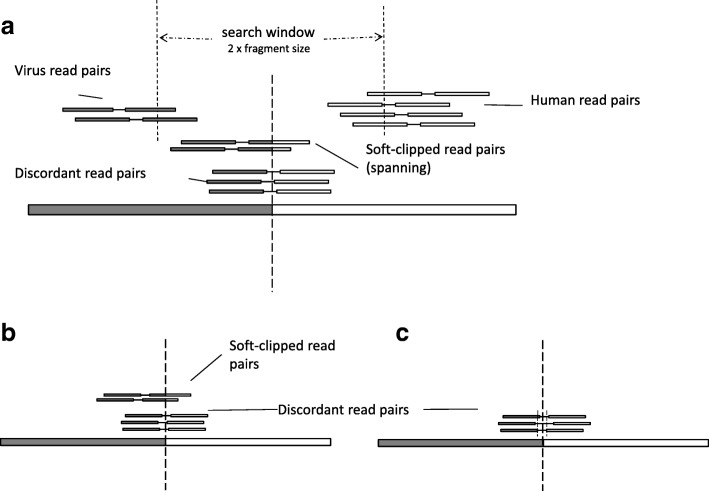
Fig. 2.
Diagram of HGT event and break point identification. a The searching starts with clustered discordant read pairs. Reads that fall within a search window of twice of the library size around the cluster are extracted. b If soft-clipped reads are available, an exact integration site can be inferred. c If only discordant read pairs are available, only an approximate integration site can be inferred

