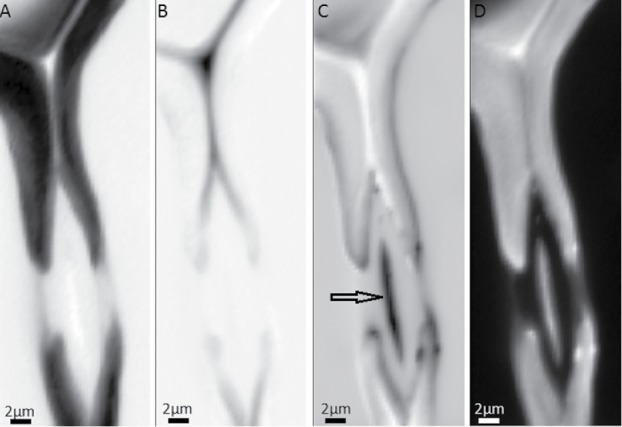
Figure 7.

Raman images of spruce tracheid pits based on vertex component analysis (VCA) using four endmembers: abundance maps visualize the secondary cell wall (A), cell corner and compound middle lamella (B) and even details of the pit structure (C) within the water filled lumen(D).
