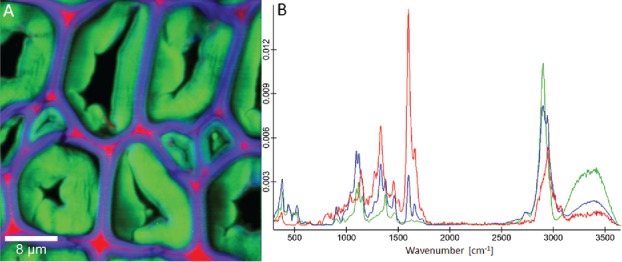
Figure 8.

Raman images (30 µm × 30 µm) of poplar tension wood based on non-negative matrix factorization (NMF) based on 4 endmembers: Beside the lumen (not shown, black area) again the three chemically most different areas, cell corner and middle lamella (red), secondary cell wall (blue) and G-layer (green) are visualized (A). The corresponding endmember spectra present pure lignin (red) and cellulose (green), while the third one (blue) represents a composite spectrum of the secondary cell wall.
