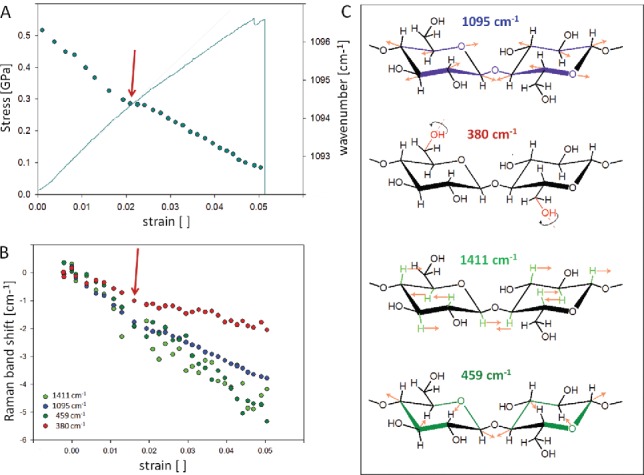
Figure 11.

Molecular changes during tensile testing of a single Ramie fiber (almost pure cellulose, microfibrils aligned parallel to the fiber). The shift of the 1097 cm−1 band is plotted together with the stress–strain curve (A) and also compared to the shift of other cellulose bands (B). The involved vibrations are assigned according to Wiley and Atalla (60) and Barsberg (200) and visualized in (C). Experimental details see in Gierlinger et al. (198).
