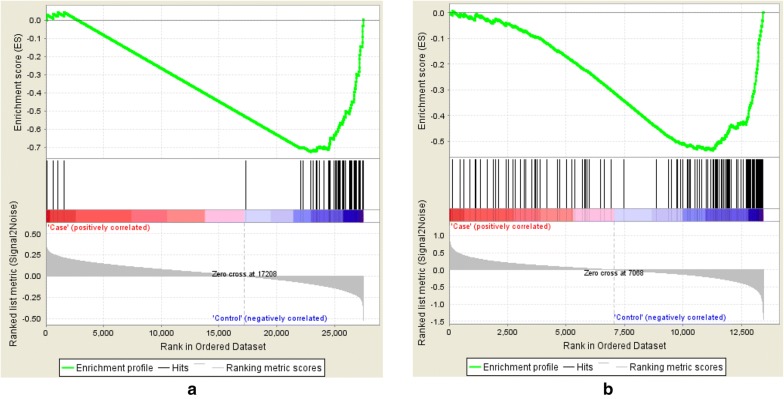
Fig. 2.
Gene set enrichment analysis (GSEA) of PPP1R3F targets in the constructed networks using the data by a Parikshak et al. [16] and b Gupta et al. [14]. Black bars in the both figures depict the rank of the PPP1R3F targets in terms of correlation with the phenotype among the entire list of genes in the both datasets

