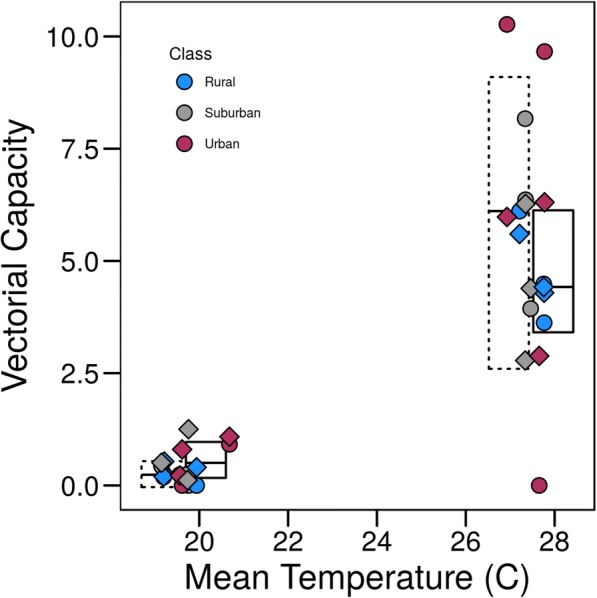
Fig. 5.

The effect of larval temperature on predicted vectorial capacity at the site and seasonal level. Points represent site-level VC calculations for field based (circle) and grand mean (diamond) calculations, with colors representing the sites’ land class. Boxes represent mean ± SD per calculation type (field based: dotted vs grand mean: solid) and season (summer vs autumn)
