
Fig. 1.
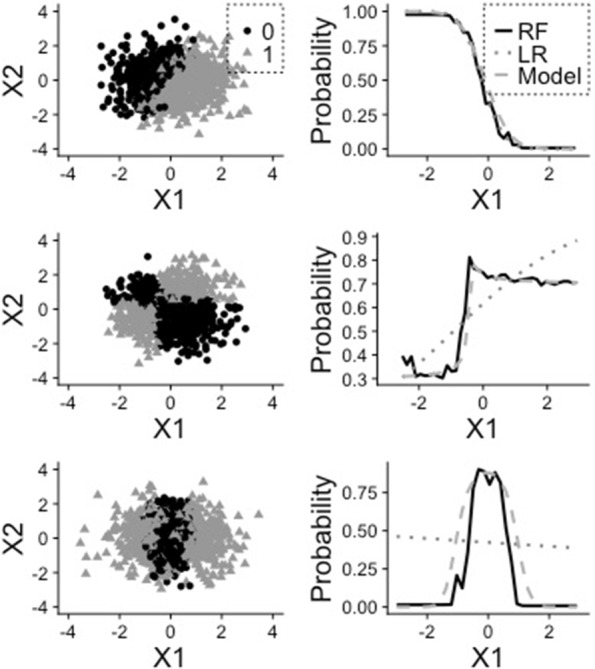
Example of partial dependence plots. Plot of the PDP for the three simulated datasets. Each line is related to a dataset. On the left, visualization of the dataset. On the right, the partial dependence for the variable X1. First dataset: β0=1,β1=5,β2=−2 (linear), second dataset: β0=1,β1=1,β2=−1,β3=3 (interaction), third dataset β0=−2,β4=5 (non-linear)