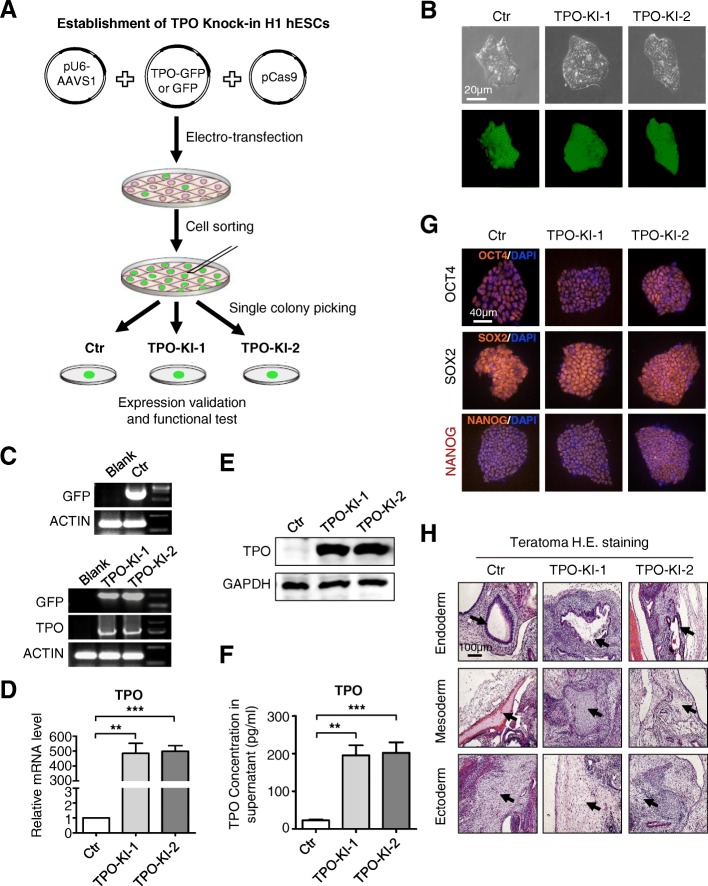
Fig. 1.
Establishment of TPO knock-in hESC lines. a Schematic of TPO-KI stable cell line establishment. GFP used as control (Ctr). b Phase-contrast images (top panel) and fluorescence images (bottom panel) of Ctr or TPO-KI-1/-2 H1 hESCs in mTeSR. Scale bar = 20 μm. c Identification of Ctr or TPO-KI-1/-2 H1 hESCs using agarose gel electrophoresis of amplified PCR products with designed primers listed in Additional file 1: Table S1. d qRT-PCR analysis of TPO expression in Ctr or TPO-KI-1/-2 H1 hESCs in mTeSR. All values normalized to level (=1) of mRNA in Ctr. Data shown as mean ± SEM (n = 3). **P < 0.01; ***P < 0.001. e Western blotting analysis confirms expression of TPO in Ctr or TPO-KI-1/-2 H1 hESCs in mTeSR. GAPDH used as loading control. f ELISA shows soluble TPO in supernatant of Ctr or TPO-KI-1/-2 H1 hESCs after 48 h culture in mTeSR. All values normalized to level (=1) of TPO concentration in Ctr. Data shown as mean ± SEM (n = 3). **P < 0.01; ***P < 0.001. g Immunofluorescence images of pluripotency markers (POU5F1, SOX2, NANOG) in Ctr or TPO-KI-1/-2 H1 hESCs in mTeSR. Scale bar = 40 μm. h Hematoxylin and eosin (H.E.) staining of representative structures in teratomas formed by Ctr or TPO-KI-1/-2 H1 hESCs. Scale bar = 100 μm. DAPI 4′,6-diamidino-2-phenylindole, GAPDH glyceraldehyde 3-phosphate dehydrogenase, GFP green fluorescent protein, hESC human embryonic stem cell, TPO thrombopoietin

