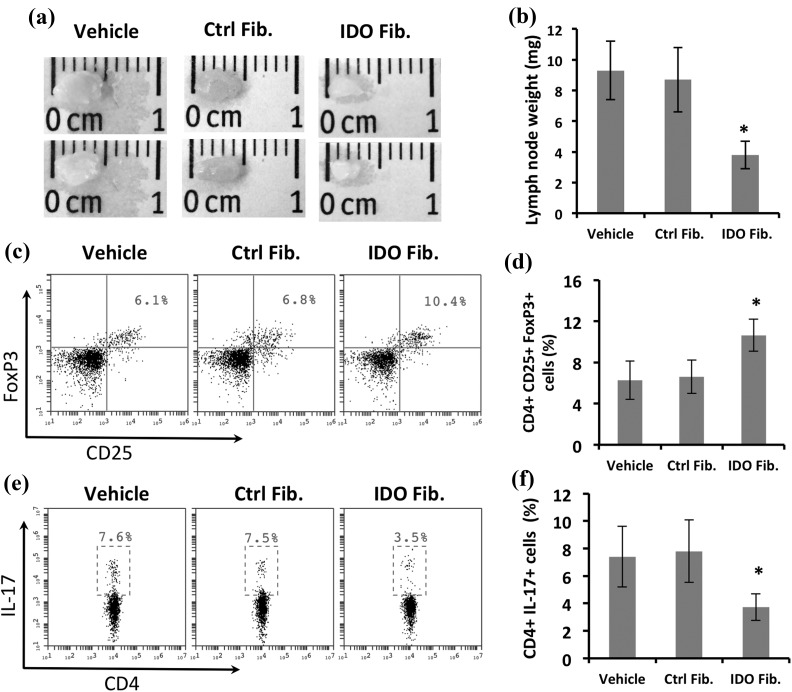
Figure 4.
Anti-inflammatory changes in skin draining lymph nodes following IDO fibroblast therapy. IDO-expressing fibroblasts, control fibroblasts, or vehicle solution were injected intraperitoneally into C3H/HeJ mice at the time of AA induction. Panels (a) and (b) show representative axillary and inguinal lymph nodes (LN) size and average weight ± SD in different treatment groups. Panels (c) and (e), respectively, show representative flow cytometry dot plots for CD25+ FoxP3+ regulatory T cells, and CD4+ IL-17+ Th17 cells, both gated on CD4+ cells in LN-derived cells. Panels (d) and (f), respectively, show average frequency ± SD of regulatory T cells and Th17 LN cells in different treatment groups using flow cytometry. *denotes statistically significant difference between IDO and the two other control groups (n = 5, P < 0.01).

