Figure 4.
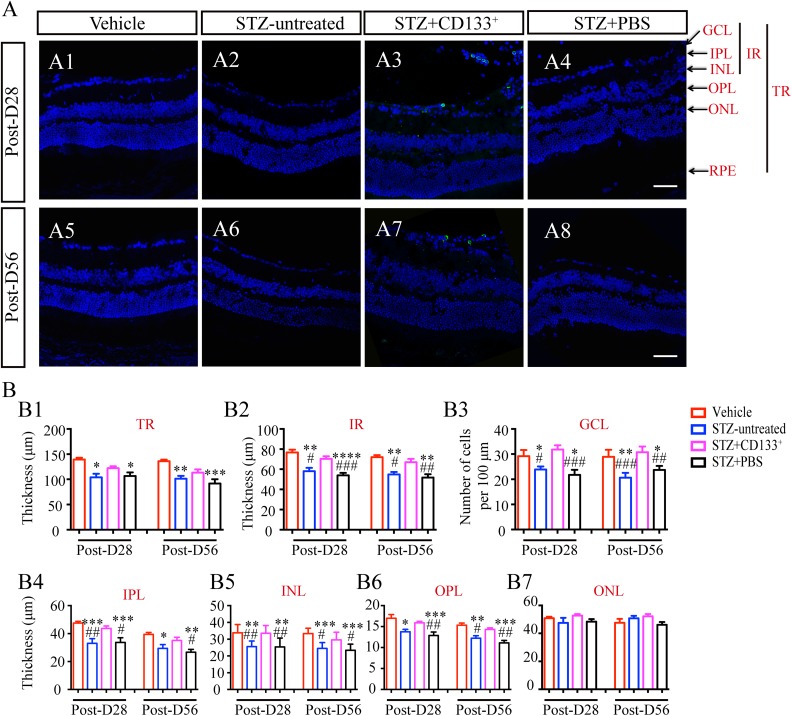
Transplanted CD133+ cells suppress inner retinal thinning in STZ-induced diabetic mice with early DR. (A) Representative images of retina from vehicle, STZ-untreated, STZ+CD133+, and STZ+PBS group and (B) statistical histograms of thickness of TR, IR and individual retina layers, and number of cells in GCL per 100 μm. CD133+ cells prevented thinning of layers in diabetic mice, especially IR, but not ONL. Values expressed as mean ± SEM (B) (n=4 eyes per group). Statistical analysis: One-way analysis of variance followed by Tukey’s multiple comparisons test for (B). Compared with vehicle group: *P<0.05, **P<0.01, ***P<0.001, ****P<0.0001; Compared with STZ+CD133+ group: # P<0.05, ## P<0.01, ### P<0.001. Scale bars represent 50 μm (A).
DR: diabetic retinopathy; IR: inner retina; GCL: ganglion cell layer; ONL: outer nuclear layer; OPL: outer plexiform layer; PBS: phosphate-buffered saline; RPE: retina pigment epithelium; SEM: standard error of the mean; STZ: streptozotocin; TR: total retina.

