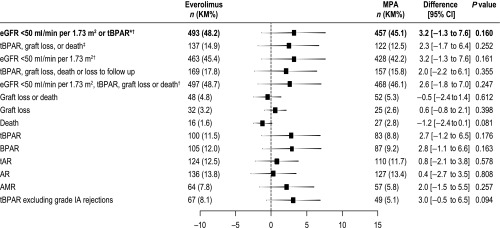
Figure 3.
All efficacy endpoints at month 12 occurred at a similar rate in the everolimus and MPA groups (ITT population). Difference was defined as everolimus − MPA. 95% CI and P values test for no difference. The primary end point is shown in bold text. *P=0.001 for noninferiority; ‡P<0.001 for noninferiority; †compared using raw incidence rates (other end points are compared using Kaplan–Meier incidence rates). AMR, antibody-mediated rejection; AR, acute rejection; ITT, intention-to-treat; KM, Kaplan-Meier; tAR, treated acute rejection.

