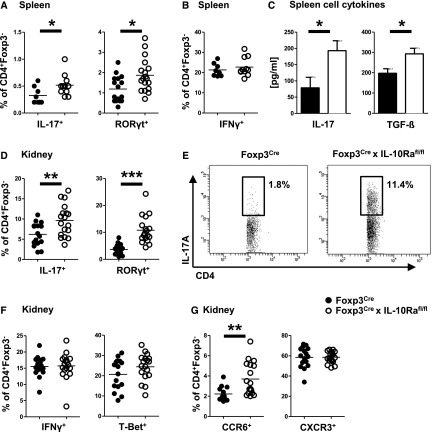
Figure 2.
Systemic and renal immunity is skewed toward Th17 during GN. All analyses derive from NTN-treated mice at day 8 (n=16 versus n=18 unless otherwise stated). (A) FACS analysis of splenic T effector cells expressing Th17 cytokine IL-17 (n=8 versus n=11) or transcription factor RORγt. (B) FACS analysis of splenic T effector cells expressing Th1 cytokine IFNγ (n=8 versus n=11). (C) ELISA analyses of the indicated Th17 cytokines from supernatant of antigen restimulated spleen cell cultures (n=8 versus n=11). (D) FACS analysis of renal T effector cells expressing Th17 cytokine IL-17 or transcription factor RORγt. (E) Representative FACS plots of renal IL-17+ Th17 cells. (F) FACS analysis of renal T effector cells expressing Th1 cytokine IFNγ or transcription factor T-Bet. (G) FACS analyses of renal T effector cells expressing Th17-type chemokine receptor CCR6 or Th1-characteristic CXCR3. Bar graphs show means, and error bars indicate SEM. Circles represent individual animals, and horizontal lines show mean values. *P<0.05; **P<0.01; ***P<0.001.

