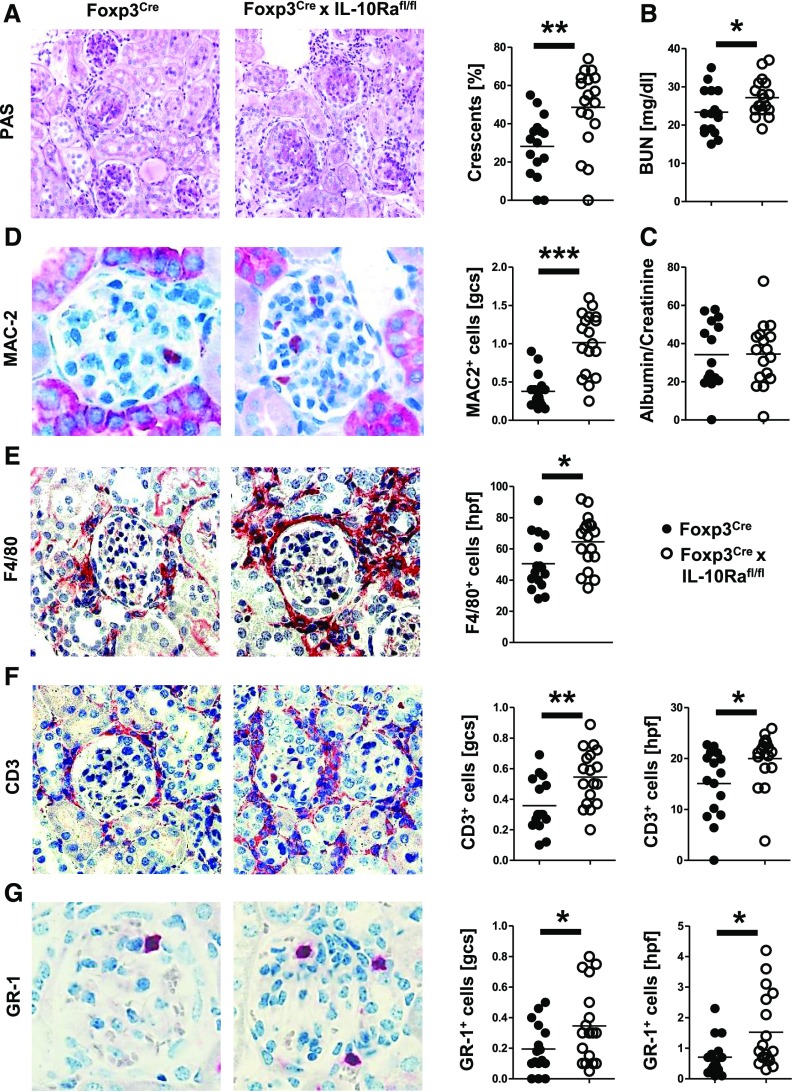
Figure 3.
Nephritis is aggravated in Foxp3CrexIL10Rafl/fl mice. All analyses derive from NTN-injected mice at day 8 (n=16 versus n=18). (A) Periodic acid–Schiff (PAS)-stained kidney sections and quantification of glomerular crescents. (B) Analyses of serum BUN levels. (C) Quantification of the urinary albumin-to-creatinine ratio. (D) Representative immunohistochemical staining and quantification of MAC-2+ glomerular macrophages. (E) Representative immunohistochemical staining and quantification of F4/80+ interstitial macrophages. (F) Representative immunohistochemical staining and quantification of CD3+ glomerular and interstitial T cells. (G) Representative immunohistochemical staining and quantification of GR-1+ glomerular and interstitial neutrophils. Circles represent individual animals, and horizontal lines show mean values. gcs, glomerular cross-section; hpf, high-power field. *P<0.05; **P<0.01; ***P<0.001.

