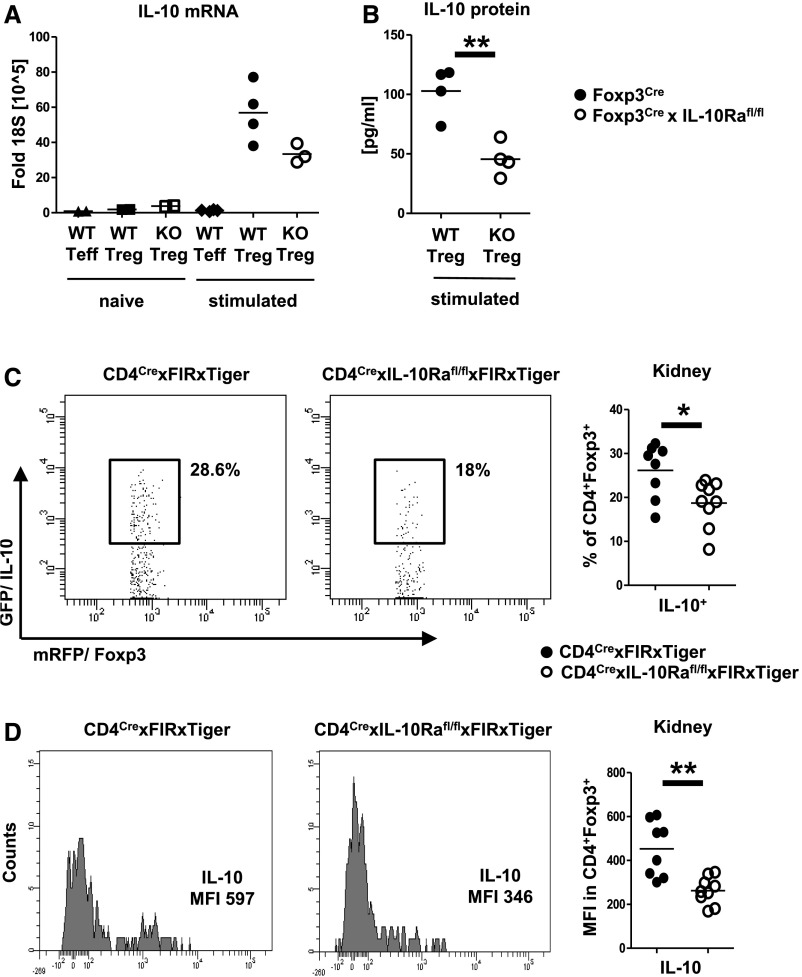
Figure 7.
IL-10 receptor a (IL-10Ra) signaling enhances IL-10 production by regulatory T cells (Tregs). (A) Semiquantitative analysis of IL-10 mRNA production by the indicated FACS-sorted spleen cell populations in the naïve state (n=2 animals per group) or after in vitro stimulation (n=4 versus n=4 versus n=3 animals per group). (B) Quantification of IL-10 by ELISA from the indicated FACS-sorted cell populations after in vitro stimulation (n=4 per group). (C) Representative FACS plots and quantification of IL-10 production by Tregs from kidneys of nephritic double-reporter mice of the indicated genotypes (n=8 versus n=9). (D) Representative FACS plots and quantification of the mean fluorescence intensity (MFI) of IL-10 in Tregs of nephritic kidneys from double-reporter mice of the indicated genotypes (n=8 versus n=9). Circles represent individual animals, and horizontal lines show mean values. KO, knockout; WT, wild type*P<0.05; **P<0.01.

