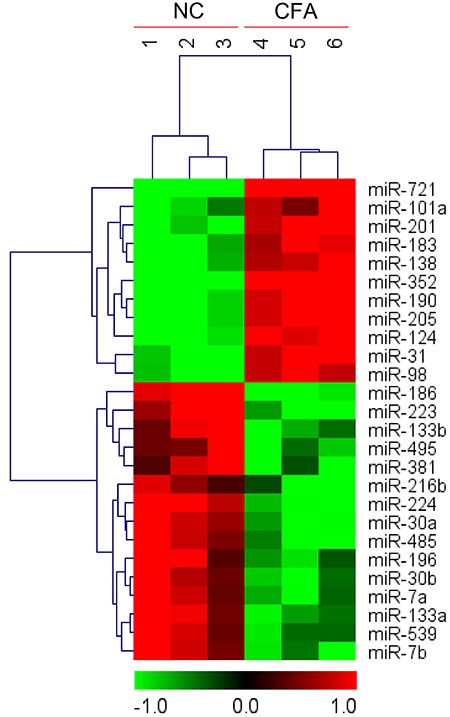
Figure 4. Microarray and hierarchical cluster analysis were performed in trigeminal ganglions (TGs) from complete Freund's adjuvant (CFA)-injected mice and control mice (NC). The figure was drawn by MeV software (version 4.2.6; The Institute for Genomic Research (TIGR), USA). Correlation similarity matrix and average linkage algorithms are used in the cluster analysis. Each row represents an individual miRNA, and each column represents a sample. The color legend at the bottom represents the level of miRNA expression, with red indicating high expression levels and green indicating low expression levels.

