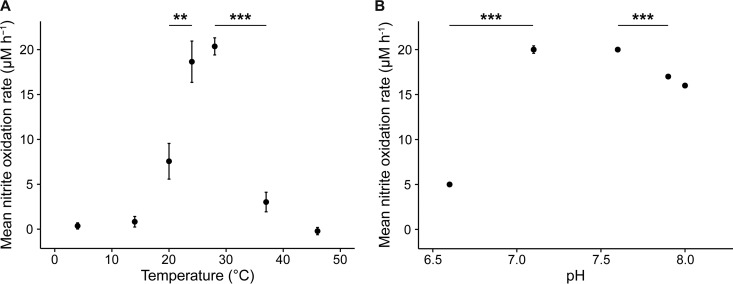
FIG 3 .
Temperature and pH optima for the nitrite-oxidizing activity of “Ca. Nitrotoga fabula.” (A) Mean nitrite oxidation rates during 48 h of incubation at different temperatures. (B) Mean nitrite oxidation rates during 21 h of incubation at different pHs. (A and B) Values are means ± standard deviations (error bars) for three biological replicates. If not visible, error bars are smaller than data points. Values that are significantly different by Welch’s t test are indicated by bars and asterisks as follows: **, P < 0.01; ***, P < 0.001.

