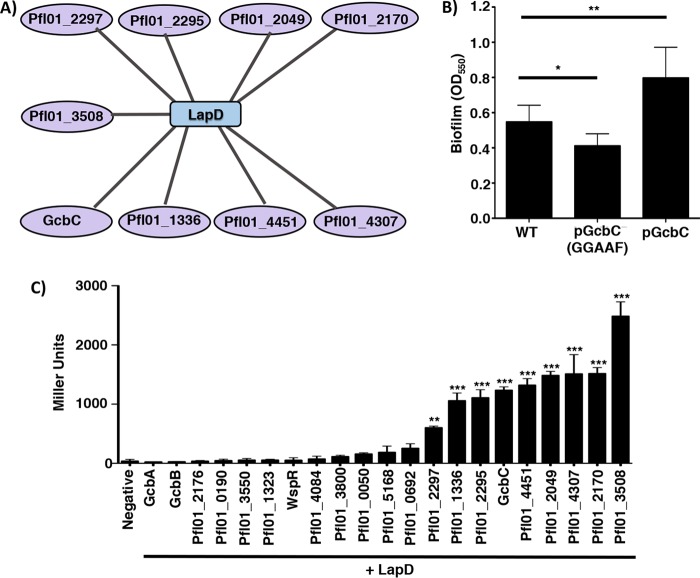
FIG 4 .
LapD interacts with multiple DGCs. (A) Interaction map of DGCs that showed a significant level of interaction with LapD by 24 h compared to the negative control by B2H assay. Data that served as the basis for this model are shown in panel C. (B) Biofilm formation of WT P. fluorescens. WT GcbC and the catalytically inactive variant (GGAAF) were expressed on plasmids. Experiments were performed in triplicate (values are means plus SDs), with an indicated P value of either <0.05 (*) or <0.01 (**) by a Student’s t test comparing each strain to WT P. fluorescens. (C) Plasmids containing each of the 21 DGCs and LapD were cotransformed into E. coli BTH101. After 24 h of incubation at 30°C, cells were scraped from the plate, and β-galactosidase levels were measured to identify LapD interaction partners. Of the 21 DGCs tested, 9 were identified as significantly interacting with LapD by B2H assay compared to the vector-only (negative) control. Pfl01_2297, Pfl01_1336, Pfl01_2295, GcbC, Pfl01_4451, Pfl01_2049, Pfl01_4307, Pfl01_2170, and Pfl01_3508 significantly interacted with LapD, but the level of interaction with LapD varied among the nine DGCs. Assays were performed in triplicate with two biological replicates (means plus SDs are shown). Statistical significance was evaluated by a one-way analysis of variance (ANOVA) analysis followed by a Tukey multiple comparison analysis test, comparing the value for each DGC-LapD interaction to the value for the negative control. Asterisks indicate a P value of either <0.01 (**) or <0.001 (***).

