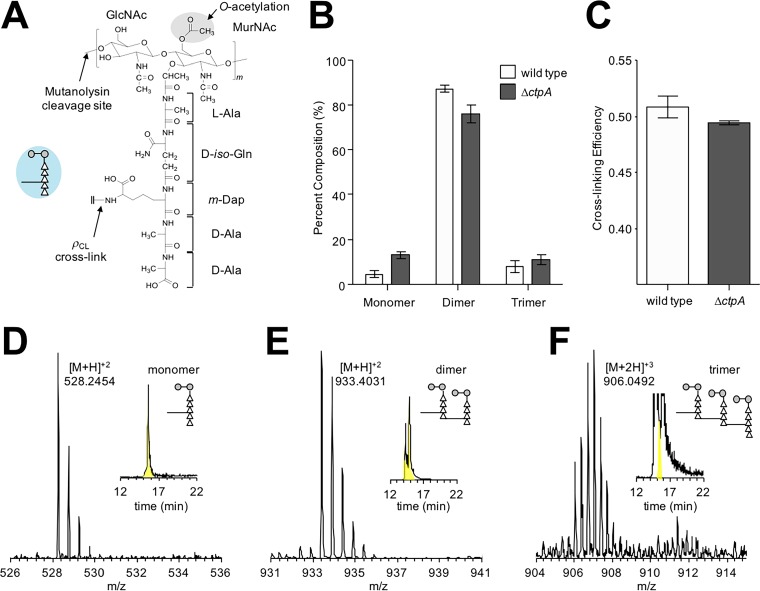
FIG 6 .
Changes in peptidoglycan composition of a ΔctpA mutant. (A) Chemical structure of the peptidoglycan repeat unit in P. aeruginosa. The disaccharide of the peptidoglycan repeat unit is shown with two modifications: O-acetylation of MurNAc at the C-6 position and amidation of d-iso-Glu in the peptide stem to d-iso-Gln. The interpeptide bridge structure in P. aeruginosa is m-DAP. A schematic representation of a peptidoglycan repeat unit is shown as a figure inset with the disaccharide as gray-filled circles, the amino acids in the pentapeptide stem as open triangles, and the interpeptide bridge structure as a line. The polymerized peptidoglycans are cross-linked by forming a peptide bond between the side chain of m-DAP from one repeat unit to the carbonyl carbon of penultimate d-Ala of a peptidoglycan stem from a neighboring glycan chain. (B) The mutanolysin-digested muropeptide fragments were characterized by LC-MS. Forty-seven unique muropeptide ions from the wild type and 33 from the ΔctpA mutant were identified from LC-MS, and each muropeptide was quantified by integrating the extracted ion chromatogram (XIC) of the selected muropeptide ion. Peptidoglycan dimers are the most abundant muropeptides found in both the wild type and ΔctpA mutant, with compositions of 87.30% ± 1.34% and 75.85% ± 3.90%, respectively. Muropeptide fragments larger than trimers were not observed. The P values for the differences between the wild-type and ΔctpA strains for monomers, dimers, and trimers based on the t test are 0.0001, 0.0003, and 0.0216, respectively. (C) The calculated peptidoglycan cross-linking efficiencies (ρCL) for the wild type and ΔctpA mutant are 50.86% ± 0.98% and 49.46% ± 0.18%, respectively, with a P value of 0.0038. All errors bars represent the 95% confidence interval (n = 3). Representative mass spectra of monomer (D), dimer (E), and trimer (F) are shown with the XICs as insets. The corresponding chemical structures are shown in Fig. S1.

