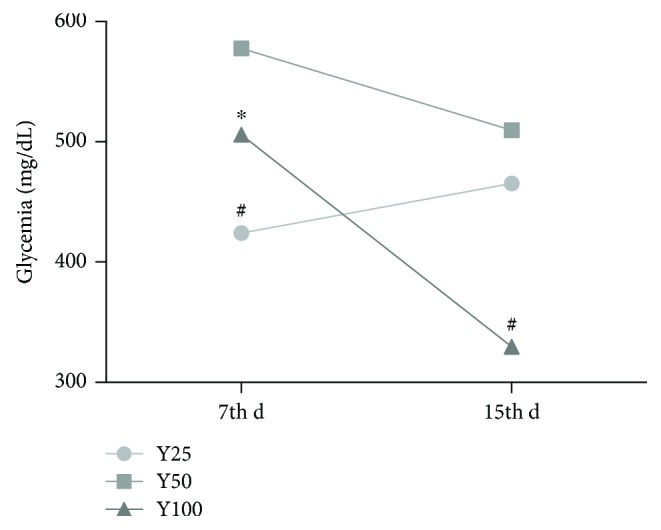
Figure 1.

Dose-response profile of Yacon leaves. The animals were randomly assigned to one of three groups: Y25, Y50, and Y100 (25, 50, and 100 mg/kg body weight/day of Yacon extract constituted in 1 mL of 0.9% saline, resp.). Diabetes mellitus was induced by one i.p. administration of streptozotocin (STZ; 40 mg/body weight), and the animals received HEYL for gavage for 15 days after the establishment of the diabetic condition and glycemia was measured at day 7 (7th d) and day 15 (15th d). C: controls; C + Y: controls treated with Yacon leaf extract; DM: diabetic controls; and DM + Y: diabetic rats treated with Yacon. The data are represented as the median. Statistical analysis was performed using the generalized linear model and one-way analysis of variance test. Significant values are represented by P < 0.05. ∗Versus Y25; #versus Y50.
